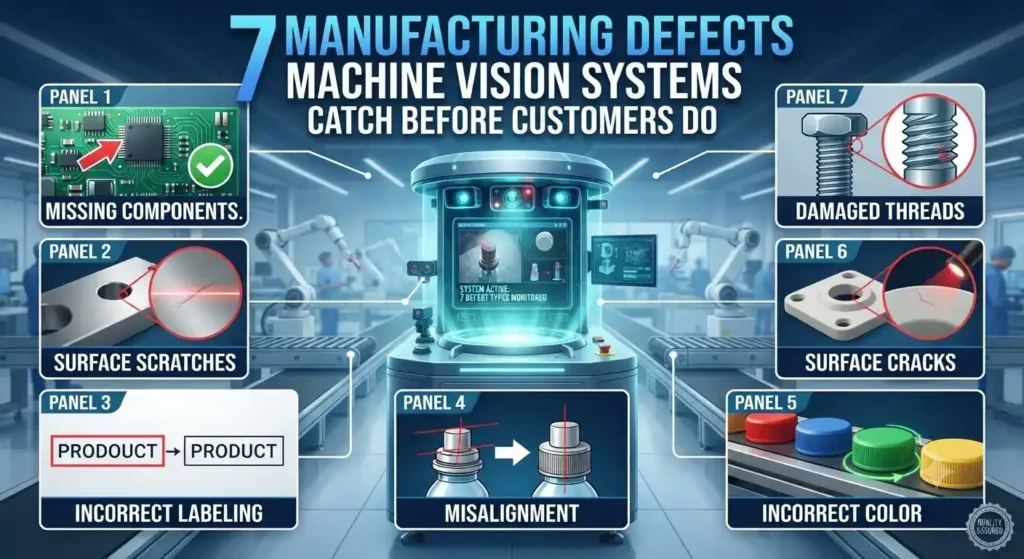
Welcome to Trident Information Systems!
Write us to - info@tridentinfo.com
Let's Socialize

Trident Information Systems

Automotive manufacturer improving forecast accuracy using D365 Finance and Operations dashboard.

Case Study : Why Automotive Demand Forecasting Fails: How Trident’s Solution Fixed It

How AI-driven demand planning powered by Microsoft Dynamics 365 F&O transformed forecast accuracy from 60% to 85%+ and reduced inventory costs by 25% for a leading automotive manufacturer 60% → 85%+ Forecast Accuracy Improvement 25% Inventory Cost Reduction Days → HoursPlanning Cycle Time The Challenge: When “Good Enough” Isn’t Good Enough Anymore A leading automotive manufacturer with a network of 200+ dealerships across multiple states came to Trident Information Systems with a problem they couldn’t ignore any longer. On paper, everything looked fine. Production lines were running at capacityDealerships were stocked with inventoryPlanning systems were in placeSales targets were being set quarterly But reality told a completely different story… Chronic Stockouts Fast-moving models were constantly out of stock at high-demand dealerships, resulting in lost sales and frustrated customers going to competitors Excess Dead Stock Slow-moving variants were piling up across dealerships, tying up working capital and requiring aggressive discounting to clear Poor Forecast Accuracy Forecast accuracy was hovering below 60% at the variant level, making production planning a guessing game Constant Firefighting Planning teams spent every week reactively adjusting allocations, reallocating stock between dealers, and managing crisis after crisis The Breaking Point Last quarter was the wake-up call. Many automotive companies missed delivery targets – not because demand was low, but because demand was wrongly predicted: The result? Lost sales, frustrated customers, and rising inventory carrying costs that were crushing margins. The Root Cause: Legacy Planning Systems Can’t Handle Modern Complexity Digging deeper, Trident’s team uncovered four fundamental failures in the manufacturer’s demand forecasting approach: 1. Excel Sheets Disconnected from Reality Demand forecasting was built on static Excel models maintained by regional planners. Each region had its own spreadsheet, formulas varied by person, and updates happened weekly (or whenever someone remembered). There was zero connection to real-time dealer demand signals — actual customer inquiries, test drives, bookings, and waitlists. 2. No Visibility into Dealer-Level Trends Headquarters could see aggregate national demand, but had no granular visibility into what was happening at individual dealerships. Was the Mumbai dealer seeing a surge in SUV interest? Was the Delhi showroom getting inquiries for electric variants? Nobody knew until it was too late. 3. Forecasts Based on History, Not Behavior The planning models relied almost exclusively on historical sales data — essentially assuming “next quarter will look like last quarter.” They completely ignored: 4. Zero Alignment Between Sales, Supply Chain, and Production Sales forecasted one thing, supply chain planned for another, and production built based on manufacturing efficiency rather than market demand. The three departments were literally working from different numbers with zero real-time alignment. “We were managing a multi-billion dollar automotive operation with the same tools we used 15 years ago. Excel, email, and phone calls. Meanwhile, customer expectations, market volatility, and competitive pressure had all multiplied 10x.” – VP of Supply Chain Planning The Solution: AI-Driven Demand Planning on Microsoft Dynamics 365 F&O Trident designed and implemented an intelligent demand forecasting framework powered by Microsoft Dynamics 365 Finance & Operations (D365 F&O), integrating AI/ML models with real-time data sources across the entire automotive value chain. How It Works: The Four-Layer Architecture Layer 1: Unified Demand Signal Aggregation Instead of relying on spreadsheets, the system now captures real-time demand signals from multiple sources: Layer 2: AI-Driven Forecasting Models Trident deployed multiple AI models optimized for different demand volatility scenarios: Layer 3: Feature Engineering & External Data Integration The models are enriched with 150+ engineered features including: Layer 4: Scenario Planning & Risk Buffering Rather than producing a single forecast number, the system generates probabilistic forecasts with confidence intervals (P50, P80, P95) allowing planners to: Real-Time Integration Across the Value Chain The D365 F&O platform unified previously siloed systems: Technology Stack The Impact: Measurable Results Within Months The transformation didn’t take years – it took months. Here’s what changed: 60% → 85%+ Forecast Accuracy (Variant-Level) 25% Inventory Holding Cost Reduction 40% ↓Stockouts for High-Demand Models Days → HoursPlanning Cycle Time 18% Reduction in Aged Inventory (90+ Days) $7.8M Annualized Cost Savings (Inventory + Lost Sales) What This Means in Practice “For the first time in a decade, our production schedule actually reflects what customers want to buy. We’ve moved from allocation-push (forcing dealers to take what we build) to market-pull (building what dealers need). The ROI has been extraordinary.” – Chief Operating Officer Key Lessons: What Makes AI-Driven Demand Planning Work 1. You Can’t Fix Forecasting with Better Spreadsheets The problem wasn’t calculation errors in Excel — it was the fundamental approach. AI models don’t just extrapolate history; they identify relationships between demand drivers that humans can’t spot across thousands of data points. 2. Real-Time Data Is Non-Negotiable Weekly batch updates are too slow. Customer preferences shift daily (influenced by competitor offers, macro news, viral social media). Real-time demand sensing captures these signals before they show up in sales numbers. 3. Integration Beats Best-of-Breed (for Demand Planning) Trying to connect CRM + DMS + Production + Finance across four separate systems creates data lag, inconsistency, and reconciliation nightmares. D365 F&O’s unified platform eliminated these issues. 4. Probabilistic Forecasts > Point Estimates Saying “we’ll sell 1,247 units next month” creates false precision. Saying “we’ll sell 1,100-1,400 units (P80 confidence)” allows planners to manage risk intelligently with safety stock and scenario planning. 5. AI Augments Planners, It Doesn’t Replace Them The system provides recommendations, but human planners make final decisions — especially when qualitative factors (upcoming regulatory changes, geopolitical events) aren’t captured in historical data. Transform Your Automotive Demand Planning Is your automotive business struggling with forecast accuracy, inventory imbalances, or misaligned production? Trident’s AI-driven demand planning solutions powered by Microsoft Dynamics 365 can help you achieve 80%+ forecast accuracy and reduce inventory costs by 20-30%. Schedule a Free Consultation → Lastly, if you’re looking to transform demand forecasting with D365 F&O, you must get a suitable partner first. It is suggested to choose from a Microsoft Dynamics 365 Implementation Partner. It’s perfect if they are old enough in the market, such as Trident Information Systems. We are a Microsoft Dynamics 365 Implementation Partner and LS Central Diamond Implementation Partner. With a robust track of accomplishments, we have gathered impressive clientage and

Case Study : Why Automotive Demand Forecasting Fails: How Trident’s Solution Fixed It Read More »

AI PPE detection using computer vision for workplace safety. Automated PPE monitoring system identifying compliance violations.

Manual PPE Checks Are Failing: How AI Computer Vision Fixes Safety Gaps

Workplace safety starts with PPE compliance – but if you’re relying on manual checks by supervisors, you’re missing nearly half of all violations. Human observers can’t be everywhere at once, they get fatigued, and they miss critical moments when workers remove hard hats, safety glasses, or gloves in high-risk zones. The result? Preventable injuries, OSHA fines, and liability exposure. Enter AI-powered computer vision: 24/7 automated PPE detection that catches violations in real-time with 98%+ accuracy. The Problem: Why Manual PPE Checks Fail Coverage Gaps Supervisors can’t monitor multiple zones simultaneously Human Fatigue Attention drops after 20-30 minutes of observation Inconsistency Different supervisors enforce rules differently Delayed Detection Violations discovered hours or days later via footage review 40% of PPE violations missed in traditional manual inspection programs (NIOSH study) Real-World Consequences The Solution: AI Computer Vision for PPE Detection Computer vision AI uses existing security cameras to automatically detect whether workers are wearing required PPE — hard hats, safety vests, gloves, masks, safety glasses, ear protection — in real-time across your entire facility. How AI PPE Detection Works Step 1: Install AI software (works with existing cameras) Step 2: Define PPE zones (hard hat required, vest required, etc.) Step 3: AI monitors 24/7, detecting PPE compliance violations Step 4: Instant alerts sent to supervisors via SMS/email/dashboard Step 5: Automated compliance reports for OSHA audits Key Capabilities of AI PPE Systems Multi-PPE Detection: Simultaneously detect 10+ PPE types (hard hat, vest, gloves, mask, goggles, ear protection, safety shoes, fall protection harness) Zone-Based Rules: Different PPE requirements for different areas (warehouse vs. production floor vs. chemical storage) Real-Time Alerts: Instant notification when violation detected — supervisors respond in seconds, not hours 98%+ Accuracy: Deep learning models trained on millions of images across lighting conditions, angles, and occlusions Privacy Protection: No facial recognition — detects PPE only, not individual identities Benefits: Why Companies Switch to AI PPE Detection 1. Reduce Workplace Injuries by 60-80% Proactive enforcement prevents injuries before they happen. Case study: Manufacturing plant reduced PPE-related injuries from 12/year to 2/year after AI deployment. 2. Achieve 99%+ PPE Compliance Rates When workers know AI is monitoring 24/7, compliance becomes habit. Behavior changes within weeks. 3. Cut Safety Labor Costs 40% Eliminate dedicated safety observers. Supervisors get alerts only when violations occur, not constant monitoring. 4. Pass OSHA Audits Effortlessly Automated compliance reports show violation trends, corrective actions, and training effectiveness. Demonstrates “serious commitment to safety.” 5. Lower Insurance Premiums Proven safety programs qualify for workers’ comp premium reductions (10-25% typical). $2.4M Average ROI in first year for facilities with 200+ workers (injury reduction + insurance savings) Industries Using AI PPE Detection Implementation: Easier Than You Think Most companies assume AI requires massive infrastructure upgrades. Reality: if you have security cameras, you’re 80% there. What You Need Typical Timeline Week 1-2: Site assessment, camera evaluation, zone definition Week 3-4: AI model training on your specific environment Week 5-6: Pilot deployment (1-2 zones), accuracy validation Week 7-8: Full rollout, staff training, dashboard setup Total: 6-8 weeks from contract to full operation Choosing the Right AI PPE Detection System Not all computer vision platforms are equal. Look for: Overcoming Common Objections “Workers will feel like they’re being spied on.”AI detects PPE compliance, not worker identity. No facial recognition. Communicate that the goal is safety, not surveillance. Most workers appreciate reduced injury risk. “Our lighting/environment is too challenging.”Modern AI handles low light, glare, occlusion, and weather. Models trained on diverse conditions. “Too expensive for our budget.”ROI typically 6-12 months via injury reduction and insurance savings. Cloud-based SaaS pricing starts at $200-$500/camera/month. The Future of Workplace Safety AI computer vision is becoming the standard for workplace safety compliance. Companies that adopt early gain: Bottom line: Manual PPE checks can’t compete with 24/7 AI monitoring. If workplace safety matters, computer vision isn’t optional — it’s essential. Ready to Fix Your PPE Compliance Gaps? See how AI computer vision can reduce injuries by 60-80% and achieve 99%+ PPE compliance in your facility. Schedule Free Safety Assessment → Trident VIS empowers industries like retail, manufacturing, healthcare, and smart city infrastructure with AI-Powered advanced video analytics solutions designed to meet their specific needs. Transform your safety, security, and operational efficiency with Vision Intelligence Systems. For more insights, follow our LinkedIn page and stay updated on the latest innovations!

Manual PPE Checks Are Failing: How AI Computer Vision Fixes Safety Gaps Read More »

Best Pharmacy Management Software in 2026: Complete Comparison & Pricing Guide

Compare the top pharmacy management software, including Microsoft Dynamics 365, LS Central, Business Central, and industry-leading solutions. Find the perfect platform for prescription management, insurance billing, compliance, and retail operations. Your pharmacy management software isn’t just technology – it’s the operational backbone that processes every prescription, manages every insurance claim, tracks every expiry date, and handles every customer interaction. Choose the wrong system, and you’ll fight it daily: rejected claims, compliance violations, inventory errors, and frustrated staff. Choose the right one, and it becomes your competitive advantage. The pharmacy management software market in 2026 offers dozens of solutions: legacy on-premise systems (PioneerRx, Liberty, QS/1), modern cloud platforms (RxVantage, BestRx), and Microsoft-powered enterprise solutions (Dynamics 365, Business Central, LS Central) that unify pharmacy operations with back-office management, retail POS, and business intelligence. This guide focuses on helping you understand: which platforms dominate the market, why Microsoft solutions are increasingly preferred for pharmacy chains and growing businesses, what features are non-negotiable, how pricing actually works, and which system fits your specific pharmacy type and size. What Is Pharmacy Management Software? Pharmacy management software is a specialized ERP system designed to handle the unique complexities of pharmacy operations — from prescription processing and insurance billing to inventory management, regulatory compliance, and retail sales. Why Generic POS or ERP Systems Fail in Pharmacies Pharmacies have requirements that generic retail or healthcare systems simply can’t handle: Prescription Management E-prescribing, refill automation, drug interaction checking, sig code translation, and clinical decision support. Insurance Billing Real-time adjudication, NCPDP D.0 claims, rejection resolution, Medicare Part D, Medicaid, PBM integration. Regulatory Compliance HIPAA, DEA controlled substance tracking, DSCSA drug traceability, state board reporting, expiry management. Inventory Control Lot and serial tracking, automated reordering from wholesalers (Cardinal, McKesson, ABC), expiry alerts, FEFO/FIFO. Retail Operations Point of sale for OTC products, loyalty programs, omnichannel (in-store, online, mobile), customer management. Analytics & Reporting DIR fee tracking, margin analysis by drug, prescription volume trends, payor mix, inventory turnover, profitability by location. Platform vs. Best-of-Breed Approach Some pharmacies use separate systems for dispensing, POS, and back-office (best-of-breed). Others prefer unified platforms like LS Central or Dynamics 365 that handle everything in one database. Unified platforms eliminate integration headaches but may have fewer specialized features. Choose based on your IT resources and complexity tolerance. Must-Have Features Every Pharmacy Needs in 2026 Not all pharmacy management software is created equal. Here are the non-negotiable features any modern system must include: ✓ Core Features Checklist Advanced Features (Competitive Differentiators) Microsoft Solutions: Dynamics 365, Business Central & LS Central for Pharmacy Microsoft offers three pharmacy-capable platforms, each designed for different business sizes and operational complexity: LS Central for Pharmacy (Recommended for Most) Best for: Independent pharmacies, regional chains (2-50 locations), and pharmacies that also run retail stores What It Is: LS Central is a unified retail and pharmacy platform built on Microsoft Dynamics 365 Business Central. It’s specifically designed for pharmacies and includes pharmacy-specific features out-of-the-box. Pricing: $50,000-$200,000 implementation + $200-$500/user/month licensing (typically 5-15 users) Timeline: 3-6 months implementation for standard deployment Microsoft Dynamics 365 Finance & Operations (Enterprise ERP) Best for: Large pharmacy chains (50+ locations), pharmaceutical distributors, hospital pharmacy systems When to Choose D365 F&O Over LS Central: Key Capabilities: Note: Dynamics 365 F&O requires pharmacy-specific add-ons or customization for prescription processing, insurance billing, and clinical features. It’s overkill for most pharmacies unless you’re enterprise-scale. Pricing: $150,000-$500,000+ implementation + $300-$500/user/month Microsoft Dynamics 365 Business Central (SMB ERP) Best for: Small independent pharmacies that need basic accounting/inventory but use separate pharmacy-specific software for dispensing Business Central is the ERP foundation that LS Central is built on. If you use a standalone pharmacy system (like PioneerRx or Liberty) but need better financial management, Business Central can handle: Pricing: $70-$120/user/month + $10,000-$50,000 implementation Why Choose Microsoft Over Competitors? Microsoft platforms integrate seamlessly with tools your staff already uses (Excel, Outlook, Teams, OneDrive). You get enterprise-grade security, HIPAA compliance out-of-the-box, and the ability to add modules (HR, advanced analytics, customer insights) without replacing your core system. Plus, Microsoft’s cloud infrastructure (Azure) offers 99.9% uptime and disaster recovery capabilities that standalone pharmacy vendors can’t match. Top 10 Pharmacy Management Software Systems Compared Here are the leading pharmacy management platforms in 2026, ranked by market share, features, and customer satisfaction: LS Central for Pharmacy Best All-in-One Platform Custom enterprise pricing PioneerRx Best for Independent Pharmacies $650 per month (single location) Liberty Software Best for Small Chains $799 per month (single location) QS/1 Best Legacy System $599 per month (single location) Dynamics 365 F&O Best Enterprise ERP $300+ per user/month BestRx Best Cloud Platform $499 per month RxVantage Best for Compounding $899 per month Cerner PharmNet Best for Hospital Pharmacies Custom enterprise pricing ComputerRx Best Budget Option $399 per month Business Central Best Back-Office ERP $70 per user/month Feature Comparison: Microsoft vs. Competitors Here’s how LS Central and Microsoft solutions stack up against leading pharmacy systems: Feature LS Central PioneerRx Liberty D365 F&O Prescription Processing ✓ Built-in ✓ Excellent ✓ Strong ✗ Requires add-on E-Prescribing (EPCS) ✓ Surescripts ✓ Surescripts ✓ Surescripts △ Custom integration Insurance Billing (NCPDP) ✓ Native ✓ Excellent ✓ Strong △ Custom Multi-Location Management ✓ Unlimited △ Limited (5-10) ✓ Good (20+) ✓ Enterprise scale Retail POS Integration ✓ Unified platform △ Basic POS ✓ Integrated ✓ D365 Commerce Financial Management (ERP) ✓ Full ERP ✗ Basic accounting △ Limited ✓ Advanced Omnichannel (Online/Mobile) ✓ Native △ Mobile app only △ Third-party ✓ D365 Commerce Business Intelligence ✓ Power BI △ Basic reports △ Standard reports ✓ Power BI Microsoft 365 Integration ✓ Seamless ✗ None ✗ None ✓ Native Cloud Hosting (Azure) ✓ HIPAA-compliant △ Third-party △ Optional ✓ Azure native Typical Implementation 4-6 months 4-8 weeks 6-12 weeks 12-18 months Best For Growing chains (5-50 stores) Single location independents Small chains (2-10 stores) Enterprise (100+ locations) Pricing Models: What You’ll Actually Pay Pharmacy software pricing varies dramatically. Here’s the realistic breakdown: Monthly Software Licensing Implementation Costs (One-Time) Hidden Costs to Budget For Total Cost of Ownership (TCO) Examples Single Independent Pharmacy (1 location): PioneerRx: $650/month × 36 months + $10K implementation

Best Pharmacy Management Software in 2026: Complete Comparison & Pricing Guide Read More »

Apparel manufacturing software dashboard managing production, inventory, and orders with size and color variants.

Best Apparel Manufacturing Software in 2026: Features, Pricing & Comparison

Compare the top apparel manufacturing software solutions including LS Central, Microsoft Dynamics 365, and industry-specific platforms. Find the perfect ERP system for your fashion, garment, or textile business. Managing an apparel manufacturing business without modern software is like trying to coordinate a fashion show in the dark. You’re juggling size and color matrices, seasonal buying cycles, production scheduling, quality control, multi-channel retail, and complex supply chains — all while fighting razor-thin margins and fast-changing trends. The apparel manufacturing software market offers dozens of solutions: legacy ERP systems, industry-specific platforms, PLM (product lifecycle management) tools, and unified retail-manufacturing platforms. Pricing ranges from $200/month for basic inventory systems to $500,000+ for enterprise implementations. Features vary wildly. And every vendor claims their solution is “built for fashion.” This guide focuses on the best comprehensive solutions for apparel manufacturers — with special emphasis on Microsoft-powered platforms (LS Central and Dynamics 365) that unify manufacturing, retail, and back-office operations. Whether you’re a contract manufacturer, fashion brand, or vertically integrated apparel business, you’ll learn exactly what to look for and which platform fits your needs. What Is Apparel Manufacturing Software? Apparel manufacturing software is a specialized ERP (Enterprise Resource Planning) system designed to manage the unique complexities of fashion, garment, and textile production — from design and sourcing to production planning, quality control, inventory management, and retail distribution. Why Generic ERP Doesn’t Work for Apparel Apparel manufacturing has unique requirements that generic ERP systems can’t handle: What Modern Apparel Manufacturing Software Actually Does Product Development Style management, tech packs, sample tracking, design-to-production workflow, CAD integration. Inventory Management Size/color matrix tracking, lot and serial numbers, warehouse management, multi-location inventory. Production Planning Cutting plans, production orders, capacity planning, shop floor control, work-in-progress tracking. Quality Control AQL sampling, defect tracking, inspection workflows, compliance documentation, traceability. Retail POS & E-commerce Point of sale, omnichannel inventory, online ordering, loyalty programs, customer management. Analytics & Reporting Cost analysis, margin tracking, demand forecasting, production efficiency, sales performance. Integrated vs. Best-of-Breed Approach Some companies use separate systems for PLM (product lifecycle), ERP (manufacturing), and retail (POS). Others prefer a unified platform like LS Central that handles all three. Integrated platforms eliminate integration headaches but may have fewer bells and whistles. Choose based on your complexity and IT resources. Must-Have Features for Apparel Manufacturers in 2026 Not all apparel software is created equal. Here are the non-negotiable features any modern solution must include: ✓ Core Features Checklist Advanced Features (Competitive Differentiators) Top 8 Apparel Manufacturing Software Solutions Compared Here are the leading apparel manufacturing platforms in 2026, with special focus on Microsoft-powered solutions: LS Central for Fashion Best All-in-One: Retail + Manufacturing Custom enterprise pricing Microsoft Dynamics 365 Best Enterprise ERP for Manufacturers $210 per user/month BlueCherry ERP Best Fashion-Specific ERP Custom per user pricing ApparelMagic Best Cloud Platform for SMBs $449 per month (unlimited users) AIMS360 Best for Wholesale Fashion $799 per month (5 users) Infor CloudSuite Fashion Best Enterprise Suite Custom enterprise licensing Backbone PLM Best PLM for Design Teams $125 per user/month Odoo Manufacturing Best Open-Source Option $24.90 per user/month LS Central for Apparel: The Complete Platform LS Central for Fashion is a unified platform built on Microsoft Dynamics 365 Business Central that combines retail POS, manufacturing ERP, and inventory management into one seamless system. It’s the best choice for vertically integrated apparel businesses that both manufacture and sell their products. LS Central for Fashion & Apparel Perfect for: Fashion brands with retail stores, apparel manufacturers selling direct-to-consumer, multi-location apparel chains Key Capabilities: Pricing: Implementation $50,000-$200,000+ (depends on locations, users, customization). Licensing $200-$500/user/month (typically 10-30 users). Implementation Timeline: 3-6 months for standard deployment, 6-12 months for complex multi-location rollouts. Best For: Mid-market to enterprise fashion brands ($10M-$500M revenue), 2-50 retail locations, manufacturing or hybrid manufacturer-retailer model. LS Central vs. Generic ERP for Apparel Requirement LS Central Generic ERP + Customization Size/Color Matrix Built-in, native support Requires custom development Retail POS Integration Unified platform Separate system + integration Omnichannel (Online + Store) Native omnichannel Third-party integration needed Fashion-Specific Workflows Pre-configured for apparel Extensive customization required Implementation Time 3-6 months 6-12+ months (custom development) Total Cost of Ownership Lower (less customization) Higher (ongoing custom maintenance) Why LS Central for Vertically Integrated Brands If you manufacture clothing AND sell it in your own stores or online, LS Central eliminates the need for separate systems. One platform handles production, warehouse, retail POS, e-commerce, and back-office — with zero integration headaches. Your inventory is always accurate across all channels because it’s literally one database. Microsoft Dynamics 365 for Fashion Manufacturing Microsoft Dynamics 365 Supply Chain Management is a comprehensive enterprise ERP platform that can be configured for apparel manufacturing with the right add-ons and customizations. Dynamics 365 for Apparel Manufacturers Best for: Large-scale apparel manufacturers, global operations, complex supply chains, companies already using Microsoft ecosystem Core Capabilities: Fashion-Specific Considerations: Pricing: Licensing: $210-$350/user/month depending on modules Implementation: $150,000-$500,000+ for enterprise deployments Ongoing: 15-20% of license cost annually for support/maintenance Implementation Timeline: 6-12 months for core ERP, 12-18 months for full deployment including customizations When to Choose Dynamics 365 Over LS Central Choose Dynamics 365 if: (1) You’re a pure manufacturer (no retail operations), (2) You need extremely advanced supply chain capabilities, (3) You’re a $500M+ revenue enterprise, (4) You already use Dynamics 365 for finance/operations. For manufacturer-retailers or mid-market brands, LS Central’s out-of-the-box fashion features make it faster and cheaper to implement. Pricing Models: What You’ll Actually Pay Apparel manufacturing software pricing varies dramatically. Here’s the realistic breakdown: Software Licensing (Monthly/Annual) Implementation Costs (One-Time) Hidden Costs to Budget For Total 3-Year Cost of Ownership Examples Small Brand (Startup – 5 users): ApparelMagic: $449/month × 36 months + $10K implementation = $26,164 Mid-Market Brand (50 employees, 5-10 stores): LS Central: $5K/month × 36 months + $100K implementation = $280,000 Enterprise Manufacturer (500+ employees): Dynamics 365: $25K/month × 36 months + $300K implementation = $1,200,000 How to Choose: 10-Step Evaluation Framework Step 1: Define Your Business Model Pure manufacturer? Manufacturer-retailer? Wholesale distributor? Your model determines which features matter most. Step 2: Calculate Your Budget (3-Year TCO) Include implementation, licenses, customization, training, support over 3 years. Don’t just look at monthly fees.

Best Apparel Manufacturing Software in 2026: Features, Pricing & Comparison Read More »

Restaurant POS system dashboard managing orders, payments, and inventory in real time.

Best POS System for Restaurants: Top Solutions & Pricing Guide 2026

Compare the top restaurant POS systems in 2026 – features, pricing, integrations, and real-world performance from fine dining to quick service. Find the perfect solution for your restaurant type and budget. Your restaurant POS system isn’t just a cash register – it’s the operational backbone of your entire business. It processes every order, tracks every dollar, manages your staff, controls your inventory, and shapes your customer experience. Choose the wrong one, and you’ll fight it every day. Choose the right one, and it becomes your competitive advantage. The restaurant POS market in 2026 is crowded with options: cloud-based tablets, legacy on-premise systems, industry-specific platforms, and everything in between. Pricing ranges from $0/month (Square, Toast free plans) to $10,000+ for enterprise installations. Features vary wildly. And every vendor claims to be “the best.” This guide cuts through the noise. Whether you’re running a quick-service restaurant, full-service dining, food truck, bar, café, or multi-location chain, you’ll learn exactly what to look for, which systems dominate each category, and how to choose the solution that fits your operation and budget. 1. What Is a Restaurant POS System? (And Why It Matters) A restaurant point-of-sale (POS) system is the technology hub where orders are taken, payments are processed, and operational data is collected. Modern restaurant POS systems do far more than just ring up sales – they’re comprehensive management platforms that run your entire operation. What Modern Restaurant POS Systems Actually Do Order Management Take orders on tablets, handhelds, or stationary terminals. Send orders directly to kitchen display systems (KDS) or printers by station. Payment Processing Accept credit cards, mobile wallets, contactless payments, and split bills. Handle tips, gift cards, and loyalty rewards. Inventory Tracking Monitor stock levels in real-time, set reorder alerts, track ingredient costs, and integrate with purchasing systems. Staff Management Time clock, shift scheduling, tip pooling, performance tracking, and labor cost optimization. Menu Management Update pricing, add seasonal items, manage modifiers, create combo meals, and sync across all ordering channels. Analytics & Reporting Sales reports, labor costs, food cost percentages, bestsellers, peak hours, and profitability analysis. Table Management Floor plans, reservations, waitlists, table status tracking, and server section assignment. Online Ordering Integrate with delivery platforms (DoorDash, Uber Eats) or run your own online ordering website. Why Your POS Choice Matters Your POS system touches every transaction, employee, and customer. A slow, unreliable, or feature-poor POS creates: longer wait times (customer frustration), order errors (kitchen chaos), payment processing delays (lost revenue), poor reporting (bad decisions), and staff frustration (turnover). Choose wisely – you’ll live with this decision for 3-5+ years. 2. Must-Have Features Every Restaurant POS Needs in 2026 Not all POS systems are created equal. Here are the non-negotiable features any modern restaurant POS must include: ✓ Core Features Checklist Advanced Features (Nice to Have) 3. Top 10 Restaurant POS Systems: Detailed Comparison Here are the leading restaurant POS systems in 2026, ranked by market share and customer satisfaction: Toast POS Best for Full-Service & QSR $69 per terminal/month Square for Restaurants Best for Small Cafés & Casual $60 per terminal/month Clover Best for Quick Service $14.95 per terminal/month Lightspeed Restaurant Best for Multi-Location $69 per terminal/month LS Central Hospitality Best for Enterprise & Chains Custom enterprise pricing Revel Systems Best for QSR Franchises $99 per terminal/month Other Notable Systems 4. Best POS by Restaurant Type Different restaurant types have different needs. Here’s what works best for each: Quick Service Restaurant (QSR) / Fast Casual Best Choice: Toast POS, Square, Clover Why: Need fast order entry, kitchen routing, self-service kiosks, and high transaction volume support. Mobile ordering and delivery integration critical. Full-Service / Fine Dining Best Choice: Toast, TouchBistro, Lightspeed, LS Central Why: Need tableside ordering, complex menu modifiers, split checks, course timing, and sommelier/wine list management. Bar / Nightclub Best Choice: Toast, Square, Lightspeed Why: Need fast bartender workflow, tab management, age verification, and inventory tracking for high-cost liquor. Café / Coffee Shop / Bakery Best Choice: Square, Clover, Toast Why: Need simple, fast checkout, tip prompts, loyalty programs, and low monthly costs. Multi-Location Chain (10+ Locations) Best Choice: LS Central, Toast, Lightspeed, Revel Why: Need centralized reporting, menu management across locations, franchisee portals, and enterprise-grade support. Food Truck / Pop-Up Best Choice: Square, Clover Why: Need mobile hardware, cellular connectivity, battery operation, and low upfront cost. 5. Pricing Models: What You’ll Actually Pay Restaurant POS pricing varies by deployment model, feature set, and processing. Here’s the real breakdown: Monthly Software Costs Payment Processing Fees (The Real Cost) This is where vendors make their money. Don’t just look at software fees – factor in processing: Example: $100,000/month in credit card sales at 2.5% = $2,500/month in processing fees. A 0.3% difference in rates = $300/month = $3,600/year. Processing fees dwarf software costs. Hardware Costs (One-Time) Total hardware for a single POS station: $1,500-$4,000 Hidden Costs to Budget For Total Cost of Ownership (TCO) Example Single-location restaurant (average $50K/month sales): Software $70/month, Processing $1,250/month (2.5% of sales), Hardware $3,000 one-time = $18,840 first year, $15,840 annually thereafter. Always calculate TCO over 3 years, not just monthly software fees. 6. Microsoft Solutions: LS Central for Hospitality & Dynamics 365 For enterprise restaurant operations, Microsoft-powered solutions offer unmatched integration with business systems: LS Central for Hospitality (Recommended for Chains) Best for: Multi-location restaurant chains, hotel restaurants, QSR franchises, central kitchen operations Key Capabilities: Pricing: Implementation: $50,000-$200,000+ (varies by size and complexity) Licensing: $200-$500/user/month (typically 5-20 users per location) Best for: 10+ location chains with $10M+ annual revenue When to Choose LS Central Over Traditional POS Why Choose Microsoft Over Competitors? LS Central integrates seamlessly with tools your corporate team already uses – Excel, Teams, Power BI, Outlook. No learning curve for back-office staff. Plus, it’s built on a unified platform (Dynamics 365 Business Central), so you can add finance, HR, or supply chain modules later without replacing your system. 7. How to Choose: 8-Step Evaluation Framework Step 1: Define Your Restaurant Type & Requirements QSR, full-service, bar, café, multi-location? List must-have features vs. nice-to-haves. Step 2: Calculate Your Budget (TCO, Not Just Monthly Fees) Include software, processing fees, hardware, setup, and 3-year total cost. Step 3:

Best POS System for Restaurants: Top Solutions & Pricing Guide 2026 Read More »

Retail store manager using retail management software dashboard to track inventory, sales, and store performance.

Retail Management Software: Complete Guide to Choosing the Right Solution

Everything you need to know about selecting retail management software in 2026 — from core features and pricing to Microsoft Dynamics 365 solutions, LS Central, and implementation best practices. Running a retail business in 2026 without modern software is like trying to compete in Formula 1 with a bicycle. Your competitors have real-time inventory visibility, omnichannel integration, AI-powered demand forecasting, and automated reordering. Meanwhile, you’re still counting stock manually, reconciling spreadsheets, and wondering why customers are buying online instead of in your store. The retail management software market is crowded with options: cloud-based platforms, legacy on-premise systems, industry-specific solutions, and everything in between. Pricing ranges from $50/month for basic POS systems to $500,000+ for enterprise implementations. Features vary wildly. And every vendor claims to be “the best.” This guide cuts through the noise. Whether you’re a single-store boutique, a multi-location chain, or a retail-manufacturing hybrid, you’ll learn exactly what to look for, which solutions dominate the market, and how Microsoft-powered retail solutions (Dynamics 365 Commerce and LS Central) stack up against the competition. 1. What Is Retail Management Software? (And What It Actually Does) Retail management software is a unified platform that connects all aspects of retail operations — from point of sale (POS) and inventory management to customer relationship management (CRM), e-commerce, and financial reporting — into a single system. Think of it as the operating system for your retail business. Instead of using separate tools for sales, stock tracking, customer data, accounting, and online orders, retail management software consolidates everything into one integrated solution. What Modern Retail Software Actually Does Point of Sale (POS) Process transactions, accept payments, manage discounts, print receipts, handle returns — all from in-store terminals, mobile devices, or web-based interfaces. Inventory Management Real-time stock tracking across all locations, automated reordering, transfer management, barcode scanning, lot/serial tracking, and stock level alerts. Customer Management (CRM) Customer profiles, purchase history, loyalty programs, personalized promotions, email marketing integration, and behavior analytics. Omnichannel Commerce Unify online and offline sales — buy online pick up in store (BOPIS), endless aisle, unified inventory, consistent pricing across all channels. Reporting & Analytics Sales dashboards, inventory reports, customer insights, profit margins, employee performance tracking, and predictive analytics. Financial Integration Automatic accounting sync, tax calculation, expense tracking, financial close automation, and compliance reporting. Why “Retail Management Software” vs. Just “POS”? A POS system handles transactions. Retail management software handles your entire business — sales, inventory, customers, employees, finances, and online/offline integration. If you’re running multiple stores or selling online, a basic POS won’t cut it. You need full retail management. 2. Why Your Retail Business Needs Modern Software in 2026 If you’re still using spreadsheets, legacy software from 2010, or disconnected point solutions for different parts of your business, you’re bleeding money and losing customers. Here’s why: 1. Customers Expect Omnichannel Experiences 72% of consumers shop across multiple channels before making a purchase (Google, 2024). They want to: Without integrated retail software, you can’t deliver this. You lose sales to competitors who can. 2. Manual Inventory Management Costs You 20-30% in Lost Sales Running out of popular items while overstocking slow-movers is expensive. Modern retail software uses AI-powered demand forecasting to predict what you’ll sell and when, automatically generating purchase orders before you run out. 3. Data-Driven Decisions Beat Gut Feel Every Time Which products are most profitable? Which promotions actually drive sales? Which employees convert best? Which store locations outperform? Modern software answers these questions with real-time dashboards and analytics — no more guessing. 4. Labor Costs Are Rising — Automation Is Essential Retail labor costs have increased 15-20% since 2020. Automating repetitive tasks (inventory counts, reordering, customer email campaigns, financial reporting) lets you do more with fewer staff hours. 5. Compliance & Security Requirements Are Stricter PCI-DSS for payment security, GDPR/data privacy regulations, tax compliance, and audit trails are mandatory. Modern retail software handles these automatically — legacy systems don’t. The Cost of Doing Nothing A mid-sized retailer (5-10 stores, $10M revenue) using outdated systems typically loses $150K-$300K annually in: stockouts and overstocking ($80K-$150K), manual labor inefficiency ($40K-$80K), customer churn from poor experience ($20K-$50K), and missed online sales opportunities ($10K-$20K). The software pays for itself in year one. 3. Core Features Every Retail Management System Must Have Not all retail software is created equal. Here are the non-negotiable features any modern solution must include: ✓ Essential Features Checklist Advanced Features (Nice to Have) 4. Cloud vs. On-Premise: Which Deployment Model Is Right for You? This is one of the first decisions you’ll face. Here’s the honest breakdown: Factor Cloud-Based On-Premise Upfront Cost Low ($0-$5K) High ($20K-$100K+) Monthly Cost $50-$500/month per location $0 (after purchase) Implementation Time 1-4 weeks 2-6 months Updates & Maintenance Automatic, free Manual, $5K-$20K/year Accessibility Anywhere with internet Only on-site or via VPN Scalability Add stores instantly Requires hardware/licenses Internet Dependency Required (offline mode limited) Works offline Data Control Vendor-hosted Full control on your servers Customization Limited to vendor options Unlimited (with developers) Our Recommendation For 95% of retailers, cloud-based is the right choice. Lower upfront cost, faster implementation, automatic updates, and no IT infrastructure to maintain. The only exceptions: 5. Microsoft Retail Solutions: Dynamics 365 Commerce & LS Central Microsoft offers two primary retail solutions built on the Dynamics 365 platform. Here’s how they differ and which one is right for you: Microsoft Dynamics 365 Commerce Best for: Mid-market to enterprise retailers with complex omnichannel operations, especially those already using other Dynamics 365 modules (Finance, Supply Chain, Customer Service). Key Capabilities: Ideal Customer Profile: Enterprise retailers (50+ stores or $100M+ revenue), omnichannel brands, B2C companies needing sophisticated digital commerce. Pricing: Custom enterprise pricing (typically $150K-$500K+ implementation, $5K-$20K/month ongoing licensing). LS Central (by LS Retail, built on Dynamics 365 Business Central) Best for: Small to mid-market retailers in specialized verticals (fashion, grocery, hospitality, fuel/convenience) who need industry-specific functionality out of the box. Key Capabilities: Ideal Customer Profile: Growing retailers (1-50 stores), fashion/apparel brands, grocery chains, specialty retail, hospitality businesses. Pricing: $50K-$150K implementation, $200-$500/user/month (typically 5-20 users). Which Microsoft Solution Should You Choose? Your Situation Recommended Solution 1-20 stores, fashion/apparel vertical LS Central Grocery,

Retail Management Software: Complete Guide to Choosing the Right Solution Read More »

Sales team using Copilot in Dynamics 365 to automate CRM workflows and analyze customer data.

Beyond the Hype: 5 Real-World Sales Workflows We Automated Using Copilot in D365

Actual automation use cases from our clients – complete with before/after metrics, implementation steps, and honest assessments of what Copilot does well (and where it still needs help). Every vendor is talking about AI. Microsoft’s pitching Copilot as a revolution in sales productivity. Your LinkedIn feed is full of posts about “AI-powered everything.” But when you ask sales leaders what they’ve actually automated with Copilot, you get vague answers about “email summaries” and “meeting notes.” Here’s the truth: Copilot in Dynamics 365 Sales is powerful, but it’s not magic. It won’t transform your sales process overnight. It won’t fix bad data or broken workflows. And it definitely won’t replace the need for good salespeople who understand their customers. What it will do – when implemented thoughtfully – is eliminate hours of administrative busywork, surface insights your reps would have missed, and help your team sell faster without working harder. This article shares five specific workflows we’ve automated for clients using Copilot in Dynamics 365 Sales. These aren’t theoretical use cases from Microsoft’s marketing materials. They’re real implementations with actual before/after metrics, honest assessments of what worked (and what didn’t), and step-by-step breakdowns you can replicate. 1. Automated Lead Qualification & Scoring The Problem A B2B software company was generating 400-500 inbound leads per month from multiple sources (website forms, trade shows, webinars, paid ads). Their SDR team of 4 people was spending 6-8 hours per day manually researching leads, reading company websites, checking LinkedIn, and trying to determine which leads were worth calling first. Result: High-value leads sat in the queue for 2-3 days before anyone reached out. By the time they got a call, 30% had already engaged with a competitor. Before Copilot Manual process: SDR receives lead → Googles company → Checks LinkedIn → Reads “About Us” page → Estimates company size and budget → Manually scores lead in spreadsheet → Enters score into D365 → Finally calls lead (24-72 hours later) With Copilot Automated process: Lead enters D365 → Copilot enriches with firmographic data (revenue, employee count, industry, tech stack) → Analyzes fit against ideal customer profile → Auto-assigns lead score → Routes to appropriate SDR → SDR calls within 2 hours with context already loaded How We Implemented It The Results Measured Impact (90 Days Post-Implementation) 87% Reduction in lead research time 2 hrsAverage lead response time (vs. 48 hrs before) 42 %Increase in lead-to-opportunity conversion $180K Additional pipeline value in first quarter What Didn’t Work Initially Copilot’s auto-scoring was too aggressive at first — it scored leads based on company size alone, ignoring buying signals. We had to refine the criteria twice before it matched our SDRs’ judgment. Also, data enrichment only works if the lead provides a company email (not Gmail/Yahoo). We now route personal email leads to a separate qualification flow. 2. Intelligent Email Follow-Up & Next-Best-Action Recommendations The Problem A manufacturing equipment distributor’s sales reps were managing 40-60 active opportunities each. They’d send a proposal, schedule a demo, or have a discovery call — then forget to follow up. Opportunities would go stale for 2-3 weeks before anyone noticed. The sales manager was manually reviewing pipeline every Monday and sending “you need to follow up on X” reminders to reps. Reps complained they couldn’t remember the context of every conversation when they did follow up weeks later. How We Automated It Before Copilot Rep sends proposal → Gets busy with other deals → Forgets to follow up → Customer goes silent → Two weeks later, sales manager asks “What happened with ABC Corp?” → Rep scrambles to piece together what happened → Customer already bought from competitor With Copilot Rep sends proposal → Copilot reminds rep to follow up in 3 days → Suggests email: “Hi [Name], following up on the proposal we discussed for [specific pain point]” → Rep reviews, edits slightly, sends → Customer responds with questions → Copilot flags as “hot opportunity” and moves to top of rep’s queue The Results Measured Impact (6 Months Post-Implementation) 73% Reduction in stale opportunities (no activity 14+ days) 3.2x More follow-up touches per opportunity 18% Improvement in win rate 4.5 hrs Saved per rep per week (no more manual pipeline review) Unexpected Benefit Reps started using Copilot-generated email summaries to brief their managers before pipeline reviews. Instead of the manager asking “What’s the status of this deal?”, reps could instantly share a 3-sentence AI summary. This cut pipeline review meetings from 90 minutes to 30 minutes and made them far more strategic. 3. Automated Meeting Prep & Post-Meeting Follow-Up The Problem An enterprise software company’s AEs were running 8-12 customer meetings per week. They’d show up to calls without reviewing the customer’s history, previous conversations, or open issues. Customers would say “I mentioned this on our last call” and the AE would have to ask them to repeat it. Post-meeting, reps were supposed to send recap emails and update D365, but often forgot or did it days later when details were fuzzy. How We Automated It Implementation Steps Enable Copilot for Sales in D365 + Teams Integration Connected Copilot to Microsoft Teams for call transcription and recording access. Configured permissions so Copilot can read calendar events and D365 records. Define Meeting Brief Template Worked with sales team to determine what information they actually want to see before calls. Created template that pulls: customer industry, previous meeting notes (last 3 meetings), open opportunities, outstanding quotes, support ticket summary. Train Copilot on Recap Email Format Provided examples of good recap emails. Copilot learned the structure: brief thank you, summary of what was discussed, clear next steps, timeline/deadline if applicable. Set Up Competitive Intelligence Triggers Created list of competitor names and product names. When mentioned in meetings, Copilot tags the opportunity and pulls battlecard information from SharePoint. The Results Measured Impact (4 Months Post-Implementation) 92% Of reps now review meeting brief before every call 3.5 hrs Saved per rep per week (meeting prep + recap writing) 68% Increase in same-day meeting recaps (vs. 22% before) 34% Reduction in “Can you remind me what we

Beyond the Hype: 5 Real-World Sales Workflows We Automated Using Copilot in D365 Read More »

AI-powered computer vision system detecting product defects on a manufacturing production line in real time.

AI-Powered Defect Detection Using Computer Vision: How It Works & Why It’s Better

A comprehensive guide to computer vision defect detection for manufacturing quality control — how the technology works, why it outperforms human inspection, and what results you can expect. Manual quality inspection is slow, expensive, and inconsistent. A trained inspector can check 300-500 parts per hour. They get tired. They miss defects. And when your production line runs 24/7, you need multiple inspection shifts — each with their own interpretation of what counts as a defect. AI-powered defect detection using computer vision changes this equation completely. One camera system can inspect 3,000-10,000 parts per hour with 99%+ accuracy. It never gets tired. It never has a bad day. And it applies the exact same quality standard to every single part, every hour, every shift. But here’s what manufacturing leaders really want to know: How does it actually work? Is it really better than experienced inspectors? What’s the ROI? And what’s required to implement it? This guide explains the technology in practical terms — how computer vision detects defects, why AI makes it more accurate than traditional machine vision, and the business case for replacing manual inspection with automated systems. How AI-Powered Computer Vision Defect Detection Works At its core, computer vision defect detection uses cameras and AI algorithms to automatically identify flaws in manufactured products. Here’s the step-by-step process: Image Capture High-resolution cameras (often multiple cameras at different angles) capture images of each part as it moves down the production line. Typical capture speed: 0.1-0.5 seconds per part. Preprocessing The AI system preprocesses the image — adjusting for lighting variations, enhancing contrast, removing noise, and isolating the part from the background. Feature Extraction The computer vision algorithm identifies key features in the image: edges, surfaces, textures, colors, patterns. This is where deep learning neural networks excel — they automatically learn which features matter for defect detection. Defect Classification The AI model compares the extracted features against its trained database of “good” and “defective” examples. It classifies the part as pass/fail and identifies specific defect types (scratch, dent, misalignment, color variation, etc.). Action & Logging If a defect is detected, the system triggers an action: reject the part (pneumatic kicker, diverter gate), alert an operator, or log the defect for analysis. All inspections are timestamped and stored for traceability. This entire process happens in milliseconds — fast enough to inspect parts on high-speed production lines running 100+ parts per minute. What Makes It “AI-Powered”? Traditional machine vision uses rule-based algorithms (if X pixels differ from template, reject). AI-powered systems use deep learning — they learn what defects look like by analyzing thousands of examples. This makes them far more accurate at detecting subtle or variable defects that rule-based systems miss. Computer Vision vs. Manual Inspection: The Reality Let’s compare computer vision defect detection against manual human inspection across the metrics that actually matter to manufacturers: Metric Manual Inspection Computer Vision + AI Inspection Speed 300-500 parts/hour 3,000-10,000 parts/hour Accuracy 80-95% (varies by fatigue, experience) 95-99.9% (consistent) Consistency Decreases over shift, varies by inspector Identical standard applied 24/7 Cost (per year) $45K-$75K per inspector × 3 shifts = $135K-$225K $50K-$150K (amortized system cost + maintenance) Scalability Requires hiring/training for increased volume Add cameras as needed, no retraining Data & Traceability Limited logging, manual records 100% inspections logged with images and timestamps Defect Types Surface defects, obvious flaws Microscopic defects, color variations, dimensional accuracy Implementation Time Immediate (hire + 1-2 weeks training) 2-6 months (system design, training, integration) The Bottom Line Computer vision is 20-30x faster, 15-30% more accurate, and 40-60% cheaper than manual inspection at scale. The tradeoff is upfront investment and implementation complexity. 20x Faster inspection speed vs. manual 99%+ Accuracy rate (vs. 80-95% manual) 50% Lower cost per inspection at high volumes 100% Inspection traceability with timestamped data Types of Defects Computer Vision Can Detect Modern AI-powered computer vision systems can detect a wide range of defect types — some that human inspectors struggle to catch consistently: Surface Defects Scratches, dents, pits, burrs, cracks, contamination, rust, corrosion, discoloration Dimensional Defects Size variations, incorrect measurements, misalignment, warping, thickness deviations Color & Texture Defects Uneven coating, color inconsistency, texture variations, gloss differences, paint defects Assembly Defects Missing components, incorrect parts, misaligned assemblies, inverted components, wrong orientation Print & Label Defects Smudged printing, incorrect text, barcode errors, missing labels, misaligned graphics Packaging Defects Seal integrity, fill level, torn packaging, label placement, wrong product in package Microscopic Defects One major advantage of computer vision: it can detect defects invisible to the naked eye. With high-resolution cameras and magnification, systems can identify: Real-World Example An automotive supplier implemented computer vision for brake pad inspection. The system detects surface cracks as small as 0.05mm — defects human inspectors only caught 60% of the time. Result: 98% defect detection rate and zero customer warranty claims from missed defects in the first year. The Technology Behind It: AI, Deep Learning & Neural Networks Understanding the technology helps explain why AI-powered systems outperform traditional machine vision and manual inspection. Traditional Machine Vision vs. AI Computer Vision Traditional Machine Vision (Rules-Based) Uses predefined algorithms and templates. Example: “If more than 50 pixels differ from the reference image by more than 10% brightness, flag as defect.” Limitation: Works well for simple, predictable defects. Struggles with variable defects, complex parts, or lighting changes. AI-Powered Computer Vision (Learning-Based) Uses deep learning neural networks trained on thousands of images. The AI learns what “good” and “defective” look like without explicit programming. Advantage: Handles complex, variable defects. Adapts to new defect types. Works across different lighting and part variations. How the AI Training Process Works Training Data Is Critical The quality of your defect detection system depends on the quality and quantity of training data. Systems trained on 10,000 diverse examples outperform those trained on 1,000. Budget time and resources for proper data collection — it’s the most important step. Key Technologies Used Implementation: What You Actually Need Implementing computer vision defect detection isn’t plug-and-play, but it’s not rocket science either. Here’s what’s required: Hardware Requirements Industrial Cameras High-resolution cameras (2MP-12MP+) with proper lenses for your part size and inspection

AI-Powered Defect Detection Using Computer Vision: How It Works & Why It’s Better Read More »

CFO reviewing financial dashboards while planning migration from Dynamics AX to D365 Finance and Operations to protect cash flow.

The CFO’s Guide: Moving from Dynamics AX to D365 F&O Without Disrupting Cash Flow

A financial executive’s roadmap to migrating from legacy Dynamics AX to D365 Finance & Operations — managing costs, timelines, and operational continuity without risking your quarter. Why CFOs Can’t Delay the AX to D365 Migration Let’s address the question every CFO asks: “Can we push this migration to 2027 or 2028?” Technically, yes. Microsoft extended support for Dynamics AX 2012 runs through October 2027. But waiting until the deadline is a financial mistake for three reasons: 1. Implementation Partners Are Already Booked Solid The best Dynamics 365 implementation partners are scheduling projects 9-12 months out. If you wait until 2026, you’ll be competing with hundreds of other companies for limited partner capacity. The result? Higher costs, longer wait times, and settling for second-tier partners. 2. Your Competitors Are Gaining Operational Advantages Now Companies that migrated to D365 F&O in 2023-2024 are already seeing benefits: faster financial close (30-40% reduction), automated cash flow forecasting, real-time reporting, and AI-powered insights. Every quarter you delay is a quarter they’re pulling ahead operationally. 3. Running Unsupported Software Is a Compliance and Security Risk After October 2027, Microsoft will no longer provide security patches or compliance updates for AX 2012. For publicly traded companies or those in regulated industries (finance, healthcare, government contracting), running unsupported ERP software creates audit failures, regulatory violations, and cybersecurity exposure that can’t be insured away. Real Cost of Waiting A mid-market manufacturer delayed their AX migration until 2026. By the time they started procurement, their preferred implementation partner was fully booked. They settled for a less experienced firm, the project ran 4 months over schedule, and the budget overrun was 42%. The CFO later admitted: “We saved nothing by waiting. We just made it more expensive and more painful.” The Window Is Closing If you start planning now (Q1-Q2 2025), you can execute a controlled migration in 2025-2026 with your choice of partners, negotiated pricing, and phased implementation that protects cash flow. If you wait until 2026, you’re at the mercy of whoever has capacity and whatever they charge. The Financial Risks of Poor Migration Planning ERP migrations fail not because of technology, but because of poor financial planning and unrealistic expectations. Here are the hidden costs that blindside CFOs who treat this as an IT project instead of a business transformation: 35% Average budget overrun on poorly planned ERP migrations 4-6 Months of reduced productivity during cutover (if poorly managed) $250K+ Hidden costs (training, data cleanup, process redesign) Where Migrations Blow Up Financially 1. Underestimating Data Migration Complexity Your AX database has 10-15 years of transactional data, custom fields, and integrations that won’t migrate cleanly. Data cleanup, mapping, and validation typically accounts for 25-35% of total project cost — but most initial budgets allocate only 10-15%. 2. Ignoring Change Management & Training Your finance team has muscle memory built around AX 2012. D365 F&O workflows are different — not just an upgrade, but a new way of working. Without proper training, you’ll see: data entry errors, missed closing deadlines, and team frustration that leads to turnover. Budget 15-20% of total project cost for training and change management. 3. Customizations That Don’t Transfer Every custom report, workflow, or integration in AX needs to be rebuilt or replaced in D365. Some can be replaced with out-of-the-box D365 features (good). Others require custom development (expensive). A thorough customization audit before migration prevents budget surprises. 4. Not Planning for Dual-System Operations During migration, you’ll run AX and D365 in parallel for 1-3 months. This means: double data entry, reconciliation between systems, and extra staff hours. Factor this into both budget and resource planning. CFO Pro Tip Add a 20-25% contingency to your initial migration budget. This isn’t pessimism — it’s reality. The projects that come in on budget are the ones that planned for the unexpected from day one. The ones that blow up are the ones where the CFO insisted on an “aggressive” budget to impress the board. Real-World Migration Costs: What You’ll Actually Pay Every CFO wants a number. Here it is — with the caveat that your actual costs depend on company size, complexity, and how much custom work you’ve done in AX. Migration Cost Breakdown (Mid-Market Company, $50M-$500M Revenue) Total Migration Budget D365 F&O Licensing (annual) $100K – $300K Implementation Services $250K – $750K Data Migration & Cleanup $75K – $150K Customizations & Integrations $100K – $300K Training & Change Management $50K – $100K Project Management (Internal) $75K – $125K Contingency (20%) $130K – $345K Total First-Year Cost $780K – $2.07M Cost Variables That Move the Needle Benchmark Reality Check According to Panorama Consulting’s 2024 ERP Report, the average mid-market D365 F&O implementation costs $850K and takes 10 months. Companies that budget below $500K or plan for under 6 months are setting themselves up for failure. Price competitively, but don’t chase the lowest bid — it always costs more in the end. Protecting Cash Flow: Phasing & Payment Structures The worst financial mistake CFOs make is treating ERP migration as a single, massive capital expenditure. Instead, structure it as a phased investment that aligns payments with deliverables and minimizes cash flow impact. Payment Structure Strategy Option 1: Milestone-Based Payments (Recommended) Tie payments to project milestones, not calendar dates. This protects you if the project runs late and aligns vendor incentives with your success. Milestone Payment % When Contract Signing 10-15% Upfront deposit Design Approval 20-25% After solution design sign-off UAT Completion 25-30% After user acceptance testing Go-Live 20-25% Day 1 of production use Post-Go-Live (30 days) 15-20% After stabilization period Option 2: Quarterly Phasing (For Budget Predictability) Spread payments across fiscal quarters to smooth cash flow impact. Negotiate fixed quarterly payments regardless of project progress — this shifts schedule risk to the vendor but requires careful SOW definition. Licensing: Annual vs. Monthly Payment Microsoft offers both annual and monthly D365 F&O licensing. CFOs often default to annual payments for the discount (typically 10-12%), but monthly payments provide flexibility during migration: This approach costs slightly more in Year 1 but provides optionality if

The CFO’s Guide: Moving from Dynamics AX to D365 F&O Without Disrupting Cash Flow Read More »

Warehouse manager using ERP dashboard to track inventory, shipments, and real-time supply chain performance.

7 Biggest Challenges in Logistics & Supply Chain Management (And How ERP Solves Them)

From visibility gaps to inventory nightmares — here’s what every logistics manager and supply chain professional struggles with, and the technology that’s transforming operations worldwide. If you manage logistics operations, run a supply chain, or oversee freight and distribution, you already know this truth: logistics and supply chain management is one of the most complex, high-pressure jobs in business. You’re coordinating hundreds of moving parts — shipments, warehouses, suppliers, carriers, customs, customers — often across multiple countries and time zones. A single delay, inventory error, or communication breakdown can cascade into thousands of dollars in losses, missed commitments, and damaged customer relationships. Yet many logistics companies are still managing these operations with disconnected systems: spreadsheets for tracking, emails for communication, separate software for warehouse management, transportation, and accounting. Every handoff is a risk. Every manual process is an opportunity for error. And every delay is invisible until it’s too late. Modern ERP systems for logistics and supply chain management are changing this. They’re unifying disparate operations into a single platform, giving you real-time visibility, automating manual tasks, and turning supply chain data into actionable insights. But before we talk about solutions, let’s be honest about the challenges. Lack of Real-Time Visibility Across the Supply Chain This is the number one complaint from logistics managers everywhere: “I don’t know where my shipments are.” When shipments move through multiple carriers, modes of transport (truck, rail, air, ocean), warehouses, and customs checkpoints, keeping track of everything in real time is nearly impossible with traditional systems. You’re relying on manual updates from drivers, emails from freight forwarders, and phone calls to warehouse managers. By the time you realize there’s a delay, the customer is already calling you asking where their order is. The Real Problem Without real-time visibility, you’re always operating in the past. You can’t proactively solve problems — you can only react to them after they’ve already hurt your business. Customers lose trust. Your team wastes hours tracking down information. And preventable delays become expensive emergencies. Why visibility breaks down: How ERP Solves This Supply chain ERP systems integrate with carriers, warehouse management systems, and supplier portals to pull live shipment data into a single dashboard. You see where every order is, in real time — from purchase order to final delivery. Automated tracking updates flow into the system without manual intervention. Alerts notify you the moment a delay happens, so you can reroute, communicate with customers, or adjust inventory plans before it becomes a crisis. Inventory Management Across Multiple Warehouses & Locations Managing inventory is simple when you have one warehouse. It becomes exponentially harder when you have multiple facilities, distribution centers, or 3PL partners — each with their own inventory counts, systems, and stock levels. The challenge isn’t just knowing what you have. It’s knowing where it is, how much is in transit, what’s committed to existing orders, and what’s actually available to sell or ship. One wrong inventory count and you’re either overstocked (tying up capital in dead inventory) or facing stockouts (losing sales and disappointing customers). The Real Problem Without unified inventory visibility, you make decisions based on incomplete information. You might promise a customer a delivery date only to find out the inventory is in the wrong warehouse. Or you reorder stock you don’t actually need because your system didn’t account for in-transit inventory. These errors cost money, delay shipments, and erode customer trust. Common inventory nightmares: How ERP Solves This Warehouse management ERP modules provide a single source of truth for all inventory across all locations. You see real-time stock levels in every warehouse, what’s in transit between facilities, what’s committed to open orders, and what’s available to promise. The system automatically tracks stock movements, reorder triggers, and batch/lot traceability. When you move inventory between warehouses, it updates instantly across finance, sales, and operations — no manual reconciliation needed. Manual Processes That Slow Everything Down Logistics is drowning in manual processes. Data entry. Status updates. Invoice reconciliation. Shipment documentation. Customs paperwork. Every handoff between warehouse, transport, finance, and customer service involves manual data transfer — often re-entering the same information into multiple systems. This isn’t just slow. It’s error-prone. A typo in a customs document delays a shipment. A data entry mistake leads to invoicing errors. A missed email means a critical update never gets communicated. The Real Problem Manual processes don’t scale. When your business grows, the workload multiplies but the hours in the day don’t. Your team spends more time updating spreadsheets than solving problems. Errors increase. Response times slow. And your competitors who’ve automated their operations outpace you. Where manual work kills productivity: How ERP Solves This Logistics ERP software automates the repetitive, manual tasks that consume your team’s time. When an order is placed, the system automatically generates shipping documents, assigns warehouse picking tasks, updates inventory, triggers carrier bookings, and sends tracking notifications to customers — without human intervention. Invoice reconciliation happens automatically by matching shipments to carrier invoices. Your team focuses on exceptions and strategy, not data entry. Poor Communication & Coordination Between Teams In logistics operations, silos are deadly. The warehouse team doesn’t know what sales promised the customer. The transport team doesn’t know finance hasn’t approved the shipment. Purchasing doesn’t know operations urgently needs a part. Everyone is working hard, but they’re not working together. Most communication happens through email threads that grow too long to follow, spreadsheets shared via Dropbox, and urgent Slack messages that get buried in noise. Critical information gets lost. Decisions are made on outdated data. And when something goes wrong, nobody has the full picture. The Real Problem Communication breakdowns lead to operational failures. A warehouse ships the wrong product because they didn’t see the order update. A driver sits idle because dispatch didn’t know the load was ready. Finance blocks a shipment because they weren’t notified it was pre-approved. Each failure costs time, money, and customer satisfaction. Why communication fails: How ERP Solves This ERP in logistics and supply chain management creates a shared workspace where all teams operate from

7 Biggest Challenges in Logistics & Supply Chain Management (And How ERP Solves Them) Read More »