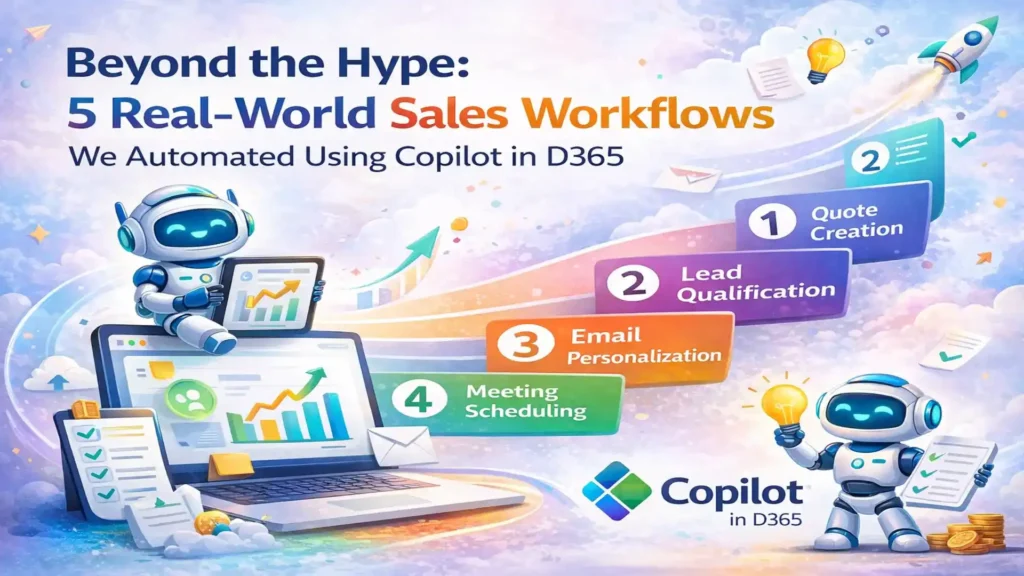
Welcome to Trident Information Systems!
Any Query? Write us to - info@tridentinfo.com
Let's Socialize

Trident Information Systems

Warehouse manager using ERP dashboard to track inventory, shipments, and real-time supply chain performance.

7 Biggest Challenges in Logistics & Supply Chain Management (And How ERP Solves Them)

From visibility gaps to inventory nightmares — here’s what every logistics manager and supply chain professional struggles with, and the technology that’s transforming operations worldwide. If you manage logistics operations, run a supply chain, or oversee freight and distribution, you already know this truth: logistics and supply chain management is one of the most complex, high-pressure jobs in business. You’re coordinating hundreds of moving parts — shipments, warehouses, suppliers, carriers, customs, customers — often across multiple countries and time zones. A single delay, inventory error, or communication breakdown can cascade into thousands of dollars in losses, missed commitments, and damaged customer relationships. Yet many logistics companies are still managing these operations with disconnected systems: spreadsheets for tracking, emails for communication, separate software for warehouse management, transportation, and accounting. Every handoff is a risk. Every manual process is an opportunity for error. And every delay is invisible until it’s too late. Modern ERP systems for logistics and supply chain management are changing this. They’re unifying disparate operations into a single platform, giving you real-time visibility, automating manual tasks, and turning supply chain data into actionable insights. But before we talk about solutions, let’s be honest about the challenges. Lack of Real-Time Visibility Across the Supply Chain This is the number one complaint from logistics managers everywhere: “I don’t know where my shipments are.” When shipments move through multiple carriers, modes of transport (truck, rail, air, ocean), warehouses, and customs checkpoints, keeping track of everything in real time is nearly impossible with traditional systems. You’re relying on manual updates from drivers, emails from freight forwarders, and phone calls to warehouse managers. By the time you realize there’s a delay, the customer is already calling you asking where their order is. The Real Problem Without real-time visibility, you’re always operating in the past. You can’t proactively solve problems — you can only react to them after they’ve already hurt your business. Customers lose trust. Your team wastes hours tracking down information. And preventable delays become expensive emergencies. Why visibility breaks down: How ERP Solves This Supply chain ERP systems integrate with carriers, warehouse management systems, and supplier portals to pull live shipment data into a single dashboard. You see where every order is, in real time — from purchase order to final delivery. Automated tracking updates flow into the system without manual intervention. Alerts notify you the moment a delay happens, so you can reroute, communicate with customers, or adjust inventory plans before it becomes a crisis. Inventory Management Across Multiple Warehouses & Locations Managing inventory is simple when you have one warehouse. It becomes exponentially harder when you have multiple facilities, distribution centers, or 3PL partners — each with their own inventory counts, systems, and stock levels. The challenge isn’t just knowing what you have. It’s knowing where it is, how much is in transit, what’s committed to existing orders, and what’s actually available to sell or ship. One wrong inventory count and you’re either overstocked (tying up capital in dead inventory) or facing stockouts (losing sales and disappointing customers). The Real Problem Without unified inventory visibility, you make decisions based on incomplete information. You might promise a customer a delivery date only to find out the inventory is in the wrong warehouse. Or you reorder stock you don’t actually need because your system didn’t account for in-transit inventory. These errors cost money, delay shipments, and erode customer trust. Common inventory nightmares: How ERP Solves This Warehouse management ERP modules provide a single source of truth for all inventory across all locations. You see real-time stock levels in every warehouse, what’s in transit between facilities, what’s committed to open orders, and what’s available to promise. The system automatically tracks stock movements, reorder triggers, and batch/lot traceability. When you move inventory between warehouses, it updates instantly across finance, sales, and operations — no manual reconciliation needed. Manual Processes That Slow Everything Down Logistics is drowning in manual processes. Data entry. Status updates. Invoice reconciliation. Shipment documentation. Customs paperwork. Every handoff between warehouse, transport, finance, and customer service involves manual data transfer — often re-entering the same information into multiple systems. This isn’t just slow. It’s error-prone. A typo in a customs document delays a shipment. A data entry mistake leads to invoicing errors. A missed email means a critical update never gets communicated. The Real Problem Manual processes don’t scale. When your business grows, the workload multiplies but the hours in the day don’t. Your team spends more time updating spreadsheets than solving problems. Errors increase. Response times slow. And your competitors who’ve automated their operations outpace you. Where manual work kills productivity: How ERP Solves This Logistics ERP software automates the repetitive, manual tasks that consume your team’s time. When an order is placed, the system automatically generates shipping documents, assigns warehouse picking tasks, updates inventory, triggers carrier bookings, and sends tracking notifications to customers — without human intervention. Invoice reconciliation happens automatically by matching shipments to carrier invoices. Your team focuses on exceptions and strategy, not data entry. Poor Communication & Coordination Between Teams In logistics operations, silos are deadly. The warehouse team doesn’t know what sales promised the customer. The transport team doesn’t know finance hasn’t approved the shipment. Purchasing doesn’t know operations urgently needs a part. Everyone is working hard, but they’re not working together. Most communication happens through email threads that grow too long to follow, spreadsheets shared via Dropbox, and urgent Slack messages that get buried in noise. Critical information gets lost. Decisions are made on outdated data. And when something goes wrong, nobody has the full picture. The Real Problem Communication breakdowns lead to operational failures. A warehouse ships the wrong product because they didn’t see the order update. A driver sits idle because dispatch didn’t know the load was ready. Finance blocks a shipment because they weren’t notified it was pre-approved. Each failure costs time, money, and customer satisfaction. Why communication fails: How ERP Solves This ERP in logistics and supply chain management creates a shared workspace where all teams operate from

7 Biggest Challenges in Logistics & Supply Chain Management (And How ERP Solves Them) Read More »

AI-powered CCTV video analytics with real-time alerts and reporting.

Best Video Analytics Software for CCTV: Features, Pricing & Integration

A comprehensive guide to choosing AI-powered video analytics software for your existing CCTV infrastructure — covering features, pricing models, integration requirements, and ROI expectations. If you’ve invested in CCTV cameras for your business, warehouse, retail store, or facility, you already have the hardware foundation for something much more powerful: AI-powered video analytics. Traditional CCTV systems simply record footage. Video analytics software transforms those cameras into intelligent sensors that can detect events, count people, recognize faces, monitor safety compliance, and alert you to security threats — all in real time, without human monitoring. The challenge? There are dozens of video analytics solutions on the market, each with different capabilities, pricing structures, and integration requirements. Some work seamlessly with your existing cameras. Others require expensive hardware replacements. Some offer basic motion detection. Others provide advanced AI-powered analytics like heat mapping, crowd density analysis, and behavioral anomaly detection. This guide will help you navigate the options, understand what features matter for your use case, and choose the right video analytics software without overpaying or getting locked into the wrong system. What Is Video Analytics Software for CCTV? Video analytics software — also called surveillance camera analytics, AI video analytics, or intelligent video analytics — is software that analyzes live or recorded video feeds from your CCTV cameras and automatically detects specific events, objects, or behaviors. Instead of requiring human operators to watch hours of footage, video analytics software uses computer vision and artificial intelligence to understand what’s happening in the video feed and trigger alerts or actions based on predefined rules. How It Works Video analytics software sits between your CCTV cameras and your monitoring system. It processes the video stream in real time, identifying: When the software detects something significant, it triggers an alert (email, SMS, push notification) or initiates an automated response (locking doors, sounding alarms, recording specific camera feeds). Key Difference: Edge vs. Server-Based Analytics Edge analytics runs on the camera itself or a local device, processing video at the source. Server-based analytics processes video on a centralized server or cloud platform. Edge is faster and more privacy-friendly; server-based is more flexible and scalable for large deployments. Why Upgrade from Basic CCTV to AI-Powered Analytics? Traditional CCTV systems are passive. They record footage, and if something goes wrong, you review the recordings after the fact. By the time you see the incident, the damage is done. AI-powered video analytics turns your cameras into proactive monitoring systems. Here’s what changes: Real-Time Alerts Get notified the moment something happens — not hours later when you review footage. Stop incidents before they escalate. Reduce Labor Costs Eliminate the need for 24/7 human monitoring. AI watches your cameras and only alerts you when something requires attention. Actionable Insights Understand traffic patterns, peak hours, customer behavior, and operational bottlenecks — data you can’t get from passive recording. Enhanced Security Detect intrusions, abandoned objects, perimeter breaches, and suspicious behavior automatically — even in low-light conditions. Real-World ROI Examples Core Features to Look For in Video Analytics Software Not all video analytics platforms are created equal. Here are the must-have features and nice-to-have advanced capabilities you should evaluate: Essential Features (Must-Have) Security & Surveillance People & Vehicle Analytics Advanced Features (Nice-to-Have) Beware of Feature Bloat Many vendors advertise 50+ features, but you’ll realistically use 5–7. Focus on what solves YOUR problems — don’t pay for capabilities you won’t use. Start simple and scale up as needed. 1. Security & Surveillance (All Industries) 2. Retail Stores 3. Manufacturing & Warehouses 4. Healthcare Facilities 5. Office Buildings & Corporate Campuses Integration Guide: Will It Work With Your Existing Cameras? This is the #1 question businesses ask: “Can I use my existing CCTV cameras, or do I need to replace everything?” The good news: Most modern video analytics software works with existing IP cameras, as long as they meet basic technical requirements. Camera Compatibility Checklist Requirements for Analytics Compatibility Common Integration Scenarios Scenario 1: Modern IP Cameras (2018+) Compatibility: Excellent. Most analytics software will work out of the box.Action: Verify ONVIF compliance and check vendor compatibility list. Scenario 2: Older IP Cameras (2015–2018) Compatibility: Likely compatible, but may have limitations (lower resolution, slower processing).Action: Test with a pilot deployment before full rollout. Scenario 3: Analog Cameras Compatibility: Not directly compatible.Action: Use a video encoder or hybrid NVR to convert analog signals to IP, OR upgrade cameras. Scenario 4: Mix of Camera Types Compatibility: Partial compatibility.Action: Deploy analytics on compatible IP cameras first; upgrade analog cameras as budget allows. What About NVR/DVR Integration? Many analytics platforms integrate with your existing NVR (Network Video Recorder) or VMS (Video Management System). The software pulls video streams from the NVR rather than connecting directly to each camera. This simplifies deployment and centralizes management. Pricing Models: What You’ll Actually Pay Video analytics pricing varies widely based on deployment model, features, and scale. Here’s a breakdown of common pricing structures: Per Camera / Month $15–$50 per camera/month Per Server License $5K–$25K one-time + annual support Enterprise Custom Custom negotiated pricing Hidden Costs to Account For Total Cost of Ownership (TCO) Don’t just compare software licensing costs. Calculate TCO over 3–5 years, including hardware upgrades, storage, bandwidth, support, and training. A cheaper solution upfront can be more expensive long-term if it requires proprietary cameras or lacks scalability. Top Video Analytics Software Solutions Compared Here’s a high-level comparison of leading video analytics platforms. Note that this is not exhaustive — there are dozens of solutions, but these represent the most established and widely deployed options. Platform Deployment Key Strengths Best For Pricing Milestone XProtect On-Premise Open platform, wide camera compatibility Mid-large enterprises Per server license Genetec Security Center On-Prem / Cloud Unified security (access control + video) Corporate campuses Custom enterprise Eagle Eye Networks Cloud Easy deployment, no servers needed Small-mid businesses Per camera/month Verkada Cloud (Hybrid) Plug-and-play, modern UI, built-in cameras Offices, retail chains Per camera/year OpenALPR On-Prem / Cloud License plate recognition specialist Parking, logistics Per camera/month Custom AI Solutions On-Premise Tailored to specific use cases Niche industries Custom project-based How to Choose Don’t pick based on brand recognition alone. Define your use case,

Best Video Analytics Software for CCTV: Features, Pricing & Integration Read More »

Modern ERP optimizing inventory and production in sweet manufacturing.

7 Biggest Challenges in Sweet Manufacturing (And How Modern ERP Solves Them)

From recipe consistency to seasonal demand spikes — here’s what every halwai, mithai shop, and namkeen manufacturer struggles with, and the technology that’s changing the game. If you run a sweet shop, halwai business, or namkeen manufacturing unit, you already know this: the sweet industry is unlike any other. You’re not just managing inventory or sales — you’re juggling perishable ingredients, complex recipes, seasonal demand swings, and quality standards that can make or break your reputation. A single batch that tastes different from the last can cost you loyal customers. Overproduction during slow months leads to waste. Underproduction during Diwali or Eid means lost revenue and disappointed buyers. And all of this has to happen while meeting food safety regulations, managing multiple retail outlets, and keeping costs under control. These aren’t small operational hiccups — they’re challenges that directly impact your bottom line, your brand, and your ability to scale. The good news? Modern ERP systems — specifically designed for food manufacturing and retail — are solving these problems for sweet businesses across India and beyond. In this article, we’ll break down the 7 biggest challenges sweet manufacturers and retailers face, and show you exactly how technology is transforming traditional mithai businesses into efficient, profitable operations. Recipe Consistency Across Every Batch This is the number one challenge every sweet manufacturer faces. Your gulab jamun, barfi, or namkeen needs to taste exactly the same whether it’s made on Monday or Friday, by your head chef or a new team member, in your flagship outlet or a branch location. But traditional sweet businesses rely on master halwais who carry recipes in their heads — or worse, on handwritten notebooks that get lost, stained, or misinterpreted. When that expert takes a day off or leaves the company, the recipe knowledge leaves with them. The Real Problem Inconsistent recipes lead to complaints, returns, and lost customers. A customer who buys your ladoo expecting a specific taste and texture will go elsewhere if the next batch is different. In the sweet business, consistency IS your brand. Why this happens: How ERP Solves This Modern ERP systems include recipe management modules that digitize every formulation. You define exact ingredient quantities, preparation steps, and quality checkpoints. When a batch is produced, the system ensures the correct ratios are used — every single time. If you need to substitute an ingredient, the system recalculates quantities automatically and tracks the change. No guesswork. No inconsistency. Managing Perishable Inventory Without Waste Unlike most manufacturing industries, sweet businesses deal with ingredients and finished products that have extremely short shelf lives. Milk, khoya, fresh fruits, nuts — these expire fast. Finished sweets can’t sit on shelves for weeks. Every day that passes reduces quality and increases the risk of spoilage. The challenge gets worse when you operate multiple outlets. How do you ensure each location has enough stock to meet demand without overproducing? How do you track expiry dates across warehouses and retail counters? The Real Problem Inventory wastage directly eats into your profit margins. If you throw away 10% of your daily production due to expiry or overstock, you’re essentially giving away 10% of your revenue. For most sweet shops, this can mean lakhs of rupees lost every year. Common inventory nightmares: How ERP Solves This ERP systems track inventory in real-time across all locations. You get automatic alerts when ingredients are approaching expiry dates. The system uses FIFO (First In, First Out) logic to ensure older stock is used first. Demand forecasting — based on historical sales data — helps you produce the right quantities. You can see exactly what’s in each outlet, what’s in transit, and what needs to be ordered — all from a single dashboard. Seasonal Demand Planning (Diwali, Eid, Weddings) The sweet industry is intensely seasonal. During Diwali, your sales might spike by 400%. During Eid or wedding season, you’re operating at maximum capacity. But for most of the year, demand is steady and predictable. This creates a planning nightmare. How much raw material should you stock before the festive rush? How many extra workers do you need? Which products will sell the most? If you under-prepare, you lose sales. If you over-prepare, you’re stuck with excess inventory that goes to waste. The Real Problem Missing the festive season rush is catastrophic for sweet businesses. Diwali alone can account for 30–40% of annual revenue for many shops. Stockouts during this period don’t just lose immediate sales — they push customers to competitors, potentially losing them forever. Why seasonal planning fails: How ERP Solves This ERP systems use historical data and demand forecasting to predict seasonal spikes accurately. You can see which products sold best last Diwali, how much raw material you needed, and when orders peaked. The production scheduling module helps you ramp up capacity ahead of time. Inventory is pre-ordered based on forecasts. Labor planning is optimized. Instead of reacting to chaos, you’re prepared weeks in advance. Food Safety Compliance & Batch Traceability Food safety isn’t optional — it’s the law. FSSAI regulations in India (and similar laws globally) require sweet manufacturers to maintain full traceability from raw materials to finished products. If there’s a quality issue or a customer complaint, you need to be able to trace which batch it came from, which ingredients were used, and when it was produced. For traditional sweet businesses operating on paper records or memory, this is almost impossible. When an inspector shows up, or a customer reports a problem, can you instantly pull up the production history? The Real Problem Non-compliance with food safety regulations can result in heavy fines, license suspension, or even business closure. Beyond legal risks, a single contamination incident — if not handled with proper traceability — can destroy your brand reputation overnight. Compliance challenges: How ERP Solves This ERP systems automate batch tracking and compliance. Every ingredient lot is logged when it arrives. During production, the system records which ingredients went into which batch. If a quality issue arises, you can instantly trace the entire supply chain — which supplier, which production date, which retail outlets received it. Quality control

7 Biggest Challenges in Sweet Manufacturing (And How Modern ERP Solves Them) Read More »

Cloud ERP migration from AX/NAV to D365 F&O with cost and timeline insights.

Dynamics 365 Finance & Operations (F&O):Everything You Need to Know Before Switching from AX or NAV

What Is Dynamics 365 Finance & Operations? Dynamics 365 Finance & Operations (F&O) — often referred to as D365 F&O or simply Dynamics 365 for Finance & Operation — is Microsoft’s flagship cloud-based enterprise resource planning (ERP) platform. It’s the modern successor to Microsoft Dynamics AX and represents a complete reimagining of how ERP systems should work in the cloud-first era. At its core, D365 F&O is designed to handle the full spectrum of financial management, supply chain operations, manufacturing, retail, and business intelligence for mid-market and enterprise organisations. Unlike its predecessors, it’s built entirely on Microsoft Azure, which means automatic updates, global scalability, and seamless integration with the broader Microsoft ecosystem — including Office 365, Power BI, and other Dynamics 365 modules like CRM. The platform is modular. You can deploy just Finance (financial management and accounting) or just Supply Chain Management (inventory, procurement, warehousing) — or combine both for a complete ERP solution. This flexibility is one of its biggest strengths, especially for businesses transitioning from older systems. Quick Definition Dynamics 365 F&O is Microsoft’s cloud-native ERP solution that replaces legacy on-premise systems like Dynamics AX and Dynamics NAV. It unifies financial management, supply chain operations, and manufacturing into a single, continuously updated platform. For businesses currently running Microsoft Dynamics AX (2009, 2012, or AX 7) or Microsoft Dynamics NAV, D365 F&O isn’t just an upgrade — it’s a strategic platform shift that brings AI, automation, and real-time analytics into every corner of your operations. The Legacy: Understanding AX, NAV & Their Limitations Before diving into why you should migrate, it’s important to understand what Dynamics AX and Dynamics NAV were — and why Microsoft built D365 F&O to replace them. Microsoft Dynamics AX (Axapta) Originally released in 1998 as Axapta, Microsoft Dynamics AX became one of the most widely deployed ERP systems for mid-to-large enterprises. It was particularly strong in manufacturing, distribution, and financial services. The most recent on-premise version, AX 2012, is still in use by thousands of companies globally — but its days are numbered. AX 2012’s limitations: Microsoft Dynamics NAV (Navision) Dynamics NAV was Microsoft’s ERP solution for small-to-midsize businesses. It offered solid financial management, inventory control, and light manufacturing capabilities. Like AX, NAV was on-premise and required significant IT resources to maintain. NAV’s limitations: Support Timeline Alert AX 2012 extended support ends in October 2027. After this date, you will no longer receive security updates, compliance fixes, or technical support from Microsoft. Running unsupported software exposes your business to significant operational and security risks. Why Businesses Are Migrating to D365 F&O Now The migration from Dynamics AX or NAV to D365 F&O isn’t just about keeping up with technology trends. There are concrete, measurable business reasons why thousands of companies are making the move — and why waiting is becoming increasingly risky. 1. End of Support = End of Security When Microsoft stops supporting AX 2012 in 2027, you’ll no longer receive security patches. This makes your ERP system — which contains your most sensitive financial and operational data — a sitting target for cyberattacks. For regulated industries (finance, healthcare, government), running unsupported software can result in compliance violations and hefty fines. 2. The Cloud Delivers Real Cost Savings On-premise ERP systems are expensive to run. You need physical servers, backup systems, IT staff to maintain them, and costly upgrade cycles every few years. D365 F&O eliminates most of this. Microsoft handles infrastructure, security, updates, and scaling. Your IT team can focus on strategy instead of server maintenance. 3. AI & Automation Are Built In D365 F&O includes AI-powered features that weren’t even possible in AX or NAV — things like intelligent cash flow forecasting, predictive maintenance for equipment, and automated expense categorisation. These aren’t add-ons; they’re woven into the platform and get better with every update. 4. Continuous Innovation Without Disruption Unlike AX, where you had to plan (and budget) for major upgrades every 3–5 years, D365 F&O receives continuous updates from Microsoft — new features, security enhancements, and performance improvements roll out automatically, twice a year. You stay current without the pain of traditional ERP upgrades. 5. Real-Time Insights, Anywhere AX and NAV were designed for desktop users sitting in an office. D365 F&O is cloud-native, which means your finance team, warehouse managers, and executives can access live data from anywhere — on their phone, tablet, or laptop. Power BI dashboards provide real-time visibility into cash flow, inventory levels, and operational performance. Key Differences: AX vs. NAV vs. D365 F&O If you’re evaluating whether to migrate, understanding the core differences between the legacy platforms and D365 F&O is critical. Here’s a side-by-side comparison to make the decision clearer. Capability Dynamics AX 2012 Dynamics NAV D365 F&O Deployment On-premise On-premise Cloud (Azure) Updates & Upgrades Manual (every 3-5 yrs) Manual Automatic (2x per year) AI & Machine Learning Not available Not available Built-in (Copilot, forecasting) Mobile Access Limited Limited Full native support Power BI Integration Via add-ons Via add-ons Native Multi-currency / Multi-entity Supported Basic Advanced Real-time Analytics No No Yes Total Cost of Ownership High (infrastructure + IT) Medium-high Lower (SaaS model) Support Status (2025) Extended only (ends 2027) Ended Active & ongoing As the table shows, D365 F&O isn’t just a newer version of AX — it’s a fundamentally different platform built for the cloud era. The shift from on-premise to cloud changes how you deploy, maintain, and evolve your ERP system. Core Capabilities of Dynamics 365 F&O D365 F&O is a comprehensive ERP platform that covers virtually every aspect of enterprise operations. Here’s what it brings to the table — and why it matters for businesses migrating from AX or NAV. Financial Management General ledger, accounts payable/receivable, budgeting, fixed assets, cash flow forecasting, multi-currency support, and real-time financial reporting. Supply Chain Management Procurement, inventory management, warehouse operations, demand forecasting, order fulfillment, and vendor collaboration — all in real time. Manufacturing Production planning, shop floor control, lean manufacturing, quality management, and IoT-connected equipment monitoring. Business Intelligence Native Power BI dashboards, embedded analytics, KPI tracking, and AI-driven insights — accessible from any device, anywhere. Retail & Commerce Point-of-sale, e-commerce integration, omnichannel customer experience, and unified inventory across physical and digital channels.

Dynamics 365 Finance & Operations (F&O):Everything You Need to Know Before Switching from AX or NAV Read More »

Microsoft Dynamics 365 CRM dashboard for sales, service, and customer engagement in 2026.

Microsoft Dynamics 365 CRM: The Complete Guide to Sales, Customer Service & Engagement in 2026

Microsoft Dynamics 365 CRM is redefining how businesses manage sales, customer service, and engagement in 2026. With AI-driven insights, automation, and unified customer data, it helps organizations build stronger relationships and close deals faster. This complete guide explores how Dynamics 365 CRM empowers teams to deliver personalized experiences, improve productivity, and stay competitive in a digital-first world. Everything you need to know about Dynamics 365 CRM — how it works, what it offers for sales and customer service teams, pricing, and why it’s the platform businesses trust to manage customer relationships at scale. What Is Microsoft Dynamics 365 CRM? Microsoft Dynamics 365 CRM is Microsoft’s flagship cloud-based customer relationship management platform. It’s not just a tool for storing contacts — it’s a comprehensive business application designed to unify how your organisation interacts with customers across every stage of the relationship, from the very first lead to long-term loyalty and retention. At its core, Dynamics 365 CRM brings together Sales, Customer Service, and Marketing into a single, connected ecosystem. Teams across your business can see the same customer data, collaborate in real time, and make decisions based on live insights rather than guesswork. What makes it stand out from other CRM platforms is its native integration with the broader Microsoft ecosystem — including Microsoft 365 (Outlook, Teams, Excel), Azure, and Dynamics 365 ERP modules like Finance & Operations (F&O). For businesses already using Microsoft products, Dynamics 365 CRM feels less like a bolt-on and more like a natural extension of what they already have. Quick Definition Dynamics 365 CRM (also referred to as Microsoft D365 CRM or MS Dynamics CRM) is a modular, cloud-native platform that helps businesses manage sales pipelines, customer support tickets, and marketing campaigns — all in one place. Whether you’re a small business scaling up or an enterprise handling thousands of daily customer interactions, Microsoft Dynamics 365 CRM is built to grow with you. Why Dynamics 365 CRM Matters in 2026 The customer experience landscape is changing faster than ever. Buyers expect instant responses, personalised communication, and seamless journeys whether they’re browsing online, calling support, or walking into a physical store. CRM platforms are no longer a nice-to-have — they’re the backbone of how modern businesses operate. So why is Dynamics 365 specifically worth paying attention to in 2026? Three reasons stand out. 95% of Fortune 500 companies use a Microsoft product $8.7B Microsoft’s Dynamics 365 annual revenue (2024) 200+ countries where Dynamics 365 is available AI Is Now Built In Microsoft has embedded Copilot — its AI assistant — directly into Dynamics 365 CRM. Sales teams can get AI-generated email drafts, automatic call summaries, and predictive lead scoring without switching apps. This isn’t an add-on; it’s woven into the interface itself. It’s Part of the Microsoft Ecosystem If your business already uses Outlook, Teams, or Excel, Dynamics 365 CRM slots in without friction. Emails logged in Outlook auto-attach to CRM records. Teams conversations are visible directly inside customer profiles. The data doesn’t live in silos — it flows. Scalability Without Complexity Unlike many CRM platforms that become painful to manage at scale, Dynamics 365 is engineered for enterprise-grade workloads. You can start with just the Sales module and add Customer Service, Marketing, or even Dynamics 365 Finance & Operations later — without re-platforming. Core Modules: Sales, Customer Service & Marketing Dynamics 365 CRM isn’t a single monolithic product. It’s a suite of focused modules, each designed to handle a specific part of the customer lifecycle. Here’s what each one does and why it matters. Dynamics 365 Sales Manage your entire sales pipeline — from lead capture to deal closure. Built-in forecasting, relationship scoring, and AI-powered suggestions help reps close faster. Dynamics 365 Customer Service Handle support tickets, cases, and customer queries across email, chat, phone, and social. Knowledge bases and automated routing cut resolution times dramatically. Dynamics 365 Marketing Build and run campaigns, nurture leads with automated journeys, and track engagement from first click to first purchase — all connected to the same CRM data. Field Service Schedule, dispatch, and track on-site technicians. Optimize routes, manage inventory, and keep customers updated — in real time. Pro Tip You don’t have to buy every module at once. Most businesses start with Dynamics 365 Sales and add Customer Service once their support volume grows. The modules share the same data layer, so there’s no painful migration between them. Key Features That Set It Apart There are dozens of CRM platforms on the market. What makes Microsoft Dynamics 365 CRM different isn’t any single feature — it’s the combination. Here are the capabilities that consistently get highlighted by businesses who’ve made the switch. Unified Customer View Every interaction a customer has with your business — an email, a support call, a purchase, a website visit — shows up in one place. Sales reps, support agents, and marketing teams all see the same 360-degree profile. No more “let me check with another team” conversations. AI-Powered Lead Scoring & Forecasting Dynamics 365 Sales uses machine learning to score leads based on behaviour patterns, engagement history, and deal characteristics. Your best reps spend time on the hottest leads, and your sales forecast becomes genuinely reliable rather than a guess. Omnichannel Customer Service Dynamics 365 Customer Service lets your support team handle conversations across email, live chat, phone, WhatsApp, and social media — all from a single workspace. The customer doesn’t have to repeat themselves. The agent sees the full history regardless of channel. Power Platform Integration Built on Microsoft’s Power Platform, Dynamics 365 CRM integrates with Power Apps, Power Automate, and Power BI. This means you can build custom apps, automate repetitive tasks, and create dashboards — all without writing a line of code. Advanced Reporting & Analytics Real-time dashboards and deep analytics are built into the platform. Track sales performance, customer satisfaction scores, agent productivity, and campaign ROI without needing a separate analytics tool. What’s New in 2026 Microsoft has rolled out Copilot for Dynamics 365 across Sales and Customer

Microsoft Dynamics 365 CRM: The Complete Guide to Sales, Customer Service & Engagement in 2026 Read More »

Cloud ERP migration checklist ensuring data integrity for SMBs.

Cloud ERP Migration Checklist: 10 Steps to Ensure Data Integrity for SMBs

Introduction: Why Data Integrity Is the Backbone of Cloud ERP Migration Moving to a cloud ERP system feels a bit like relocating your entire business to a new city. You’re excited about better infrastructure, lower costs, and room to grow—but there’s also anxiety. What if something important gets lost during the move? For small and medium-sized businesses (SMBs), that “something” is usually data. Customer records, financial transactions, inventory details, supplier contracts—this information is the lifeblood of daily operations. If data integrity breaks during migration, everything downstream suffers. Data integrity isn’t just about preventing data loss. It’s about ensuring that information remains accurate, consistent, complete, and trustworthy throughout the migration process and beyond. A single duplicated invoice or mismatched customer record can ripple through accounting, reporting, and decision-making. SMBs often operate with lean teams and tight margins, so even small data errors can become expensive problems. Cloud ERP migration adds another layer of complexity. Unlike traditional on-premise systems, cloud platforms involve data transfers over networks, integrations with third-party tools, and new security models. Without a structured checklist, migrations can quickly turn chaotic. That’s why a step-by-step approach is critical. Think of it as a flight checklist—pilots don’t skip steps, no matter how experienced they are. This guide walks you through a practical, SMB-friendly cloud ERP migration checklist with a sharp focus on data integrity. These ten steps are designed to help you move confidently, avoid common pitfalls, and come out the other side with clean, reliable data that actually supports growth rather than slowing it down. Step 1: Define Clear Migration Goals and Data Integrity Standards Before touching a single database or exporting any files, you need clarity. Many ERP migrations fail not because of technology, but because of fuzzy goals. SMBs often jump into migration driven by urgency—legacy systems are slow, expensive, or unsupported. But urgency without direction is risky. Start by defining why you’re migrating to a cloud ERP. Are you aiming for real-time reporting? Better inventory accuracy? Easier scalability? Lower IT overhead? Each goal influences how data should be handled. For example, if real-time analytics is a priority, historical data accuracy becomes non-negotiable. Once goals are clear, translate them into data integrity standards. This means defining what “good data” looks like for your business. Accuracy ensures data reflects reality. Consistency means the same data tells the same story across modules. Completeness ensures no critical fields are missing. Timeliness ensures data is up to date. These standards act like guardrails throughout the migration. Document these expectations and share them with stakeholders, vendors, and internal teams. When everyone agrees on what success looks like, decisions become easier. You’ll know which data is worth migrating, which needs cleaning, and which can be archived. This upfront alignment saves time, money, and frustration later in the process. Step 2: Conduct a Comprehensive Data Audit Before Migration A cloud ERP migration is not the time to carry digital clutter into a shiny new system. Yet many SMBs do exactly that, migrating years of unused, outdated, or incorrect data simply because “it’s always been there.” A data audit helps you avoid this trap. Begin by identifying all data sources feeding into your current ERP environment. These may include accounting systems, CRM platforms, inventory tools, spreadsheets, and even manual databases maintained by departments. You might be surprised how much shadow data exists outside the core system. Next, categorize data into what’s essential, what’s useful, and what’s unnecessary. Redundant, obsolete, and trivial (ROT) data adds risk without value. Old vendor records, inactive customers, or discontinued product lines often don’t need to make the journey. Removing them reduces migration complexity and improves performance in the new system. A thorough audit also uncovers data quality issues—duplicates, missing fields, inconsistent formats, and outdated values. Treat this step like a health check. The goal isn’t perfection, but awareness. When you know what you’re working with, you can plan cleaning, mapping, and validation more effectively. This audit sets the foundation for a successful, integrity-driven migration. Step 3: Cleanse and Standardize Data for Cloud Readiness If your data were a house, cleansing would be the deep clean before moving day. It’s not glamorous, but it’s essential. Dirty data migrated into a cloud ERP doesn’t magically improve—it usually becomes more visible and more damaging. Start with deduplication. Duplicate customer records, suppliers, or SKUs can distort reports and confuse users. Use automated tools where possible, but don’t underestimate the value of human review for critical records. Accuracy matters more than speed here. Next, correct errors and fill in missing values. Inconsistent addresses, incorrect tax codes, or incomplete product descriptions can break workflows in the new system. Standardization is equally important. Decide on naming conventions, date formats, units of measure, and currency representations. Cloud ERP systems thrive on uniformity, and standardized data ensures smoother automation and reporting. This step can feel time-consuming, especially for SMBs with limited resources. But think of it as an investment. Clean, standardized data improves user adoption, system performance, and decision-making from day one. Skipping this step is like pouring clean water into a dirty glass—you’ll never get the clarity you expect. Step 4: Choose the Right Cloud ERP Platform for SMB Needs Not all cloud ERP platforms are created equal, especially when it comes to data integrity. SMBs need solutions that balance robustness with simplicity. Choosing the wrong platform can introduce unnecessary complexity and risk. Evaluate vendors based on their data security measures, compliance certifications, and track record with SMBs. Look for built-in validation rules, audit trails, and data governance features. These tools act as safety nets, preventing bad data from entering or spreading within the system. Scalability and integration capabilities also matter. Your cloud ERP should integrate smoothly with CRM, e-commerce, payroll, and analytics tools. Poor integrations often lead to manual workarounds, which increase the risk of data errors. Finally, consider vendor support and migration assistance. A provider experienced in SMB migrations understands common pitfalls and can guide you through best practices. The right platform doesn’t just store your

Cloud ERP Migration Checklist: 10 Steps to Ensure Data Integrity for SMBs Read More »

LS Central transforming traditional sweet production into digital workflows.

From Traditional to Digital: Modernizing Sweet Production with LS Central

India’s sweet industry, valued at over $8 billion in 2025, thrives on festive demand but grapples with outdated methods amid rising competition. Traditional sweet production faces waste, inconsistency, and compliance hurdles, yet LS Central—a Microsoft Dynamics 365-based ERP—transforms these challenges into opportunities for efficiency and growth. This guide explores how sweet shops and manufacturers can modernize operations to boost profitability and scale seamlessly. Challenges in Traditional Sweet Production Manual processes dominate traditional mithai making, from ledger-based inventory to eyeball quality checks. During Diwali or Raksha Bandhan, shops often overstock perishables like khoya or underprepare for sudden surges, leading to 20-30% waste. Inconsistent recipes cause taste variations, eroding customer loyalty, while poor traceability complicates FSSAI compliance and allergen management.​ Supply chain disruptions, like ghee shortages, amplify issues without real-time visibility. Small producers juggle multiple suppliers via calls, risking adulteration or delays. Scaling to e-commerce or multi-outlets remains fragmented, limiting growth in a market projected to hit $10 billion by 2027.​ These pain points hinder profitability, with many shops operating at 40-50% margins due to inefficiencies.​ What is LS Central? LS Central is an all-in-one retail ERP platform powered by Microsoft Dynamics 365, tailored for food businesses including sweets and confectionery. It integrates POS, inventory, CRM, and analytics into a unified system, enabling real-time data across production, sales, and supply chains. Unlike siloed tools, it supports omni-channel operations for dine-in, delivery, and online orders.​ Key modules include recipe management for precise formulations, batch tracking for quality, and AI-driven forecasting. Built for scalability, it serves single shops to chains, with mobile access for on-the-go monitoring. In food sectors, it handles perishables via expiry alerts and lot traceability.​ Feature Traditional Tools LS Central Advantage Data Integration Spreadsheets/ledgers Cloud-based real-time sync ​ Scalability Manual expansion Multi-store/outlet support Reporting Monthly summaries Live dashboards and AI insights Cost Hidden inefficiencies ROI in 6-12 months ​ This setup empowers sweet producers to focus on craftsmanship while automating the rest. Inventory and Supply Chain Optimization LS Central revolutionizes inventory by tracking raw materials like sugar, nuts, and besan from vendor receipt to final packaging. Automated reordering triggers purchase orders when stock dips below thresholds, using sales data for precise forecasts—cutting overstock by up to 25% during off-seasons.​ For peak festivals, demand sensing analyzes historical patterns and trends, scaling procurement dynamically. Supplier portals enable direct PO approvals and delivery schedules, reducing lead times from days to hours. In confectionery, it manages variants like sugar-free or vegan options with segregated stock.​ Traceability logs every batch: a contaminated nut lot triggers instant recalls, protecting brand reputation. Multi-warehouse sync ensures balanced distribution across outlets, minimizing shortages. Sweet shops report 15-20% inventory cost savings post-implementation.​ Quality Control and Recipe Standardization Consistency defines premium sweets, yet traditional methods rely on artisan intuition, leading to batch variations. LS Central digitizes recipes, specifying exact ratios for gulab jamun syrup or motichoor ladoo besan, ensuring uniform taste across locations.​ Custom audits track production parameters: temperature for jalebi frying, moisture for barfi setting. Allergen segregation flags cross-contamination risks, auto-generating FSSAI-compliant labels with ingredient disclosures. For exports, full lot traceability meets global standards like HACCP.​ In sweets manufacturing, it supports R&D by versioning recipes for healthier twists, like low-glycemic options amid rising diabetes concerns. Quality scores integrate with supplier ratings, blacklisting unreliable sources. Benefits include: This builds consumer trust in an industry where one bad batch can tarnish years of goodwill. Omni-Channel Sales and Customer Engagement Modern sweet buyers expect convenience: online hampers, app orders, or in-store pickup. LS Central unifies channels via integrations with Shopify, Zomato, or custom e-stores, syncing inventory to prevent overselling.​ POS terminals handle high-volume festive rushes with ScanPayGo for contactless payments and loyalty scans. Kitchen display systems (KDS) route orders to production, slashing wait times for fresh packs. Self-service kiosks let customers customize boxes, boosting upsells.​ CRM tracks preferences: Diwali loyalists get personalized offers like “Buy 1kg barfi, get rasgulla free.” Analytics reveal top-sellers, optimizing menus—e.g., surging demand for millet-based sweets. Channel Traditional Handling LS Central Integration In-Store POS Cash/manual Touchscreen, mobile ​ Online Orders Separate apps Unified inventory Delivery Third-party manual API-driven, real-time ETAs Loyalty Punch cards App-based points, SMS alerts Retailers see 20% repeat sales uplift.​ Step-by-Step Guide to Modernize Your Sweet Shop Transitioning is straightforward with LS Central’s modular rollout. Common challenges like data migration are handled by cloud backups. Future-Proofing Sweet Production in 2026 As AI evolves, LS Central’s updates promise predictive maintenance for machinery and personalized hampers via machine learning. Sustainability features track carbon footprints for eco-conscious buyers. In Ghaziabad’s bustling sweet hubs, early adopters lead with digital agility. Modernizing isn’t optional—it’s survival in a $10B+ market.​ Conclusion LS Central empowers sweet producers to evolve from labor-intensive traditions to agile, data-driven operations, slashing waste, ensuring quality, and unlocking omni-channel growth. With proven ROI in months and scalability for 2026’s demands, it’s the ultimate tool for thriving in India’s booming sweets market. Sweet shop owners: Demo LS Central today to secure your competitive edge and delight customers like never before. Lastly, if you are looking for an LS Retail Implementation Partner, you can contact Trident Information Systems. We are a Gold D365 Implementation Partner and LS Retail Diamond Partner. With years of experience, we have managed to help various businesses thrive in the market with powerful insights and customized solutions. For further information, Contact Us Today. Follow our LinkedIn page for insightful updates on Retail ERP and the future of the retail industry. FAQ What is LS Central, and is it suitable for sweet production?LS Central is a Dynamics 365-based ERP for retail and food businesses, perfect for sweets with features like recipe standardization and perishables tracking.​ How much waste can LS Central reduce in sweet shops?Up to 25% through automated inventory and demand forecasting, especially during festivals.​ What’s the implementation timeline for LS Central?Typically 3-6 months for mid-sized operations, starting with a pilot outlet.​ Does LS Central support FSSAI compliance for sweets?Yes, with batch traceability, allergen labeling, and audit-ready digital logs.​ How does LS Central integrate with e-commerce for sweet sales?Seamlessly with Shopify or Zomato, syncing stock for online hampers and deliveries.​

From Traditional to Digital: Modernizing Sweet Production with LS Central Read More »

CEO-focused Power BI dashboard displaying real-time business performance metrics.

The Executive Dashboard: 5 Power BI KPIs Every CEO Should Watch Daily

In an era where decisions are made at the speed of data, executive dashboards have become the command center for modern leadership. We believe that Power BI dashboards are no longer optional tools—they are strategic assets that translate complex data into decisive action. For CEOs, the challenge is not access to data, but clarity. The right Key Performance Indicators (KPIs), visualized effectively through Microsoft Power BI, can illuminate risks, uncover opportunities, and keep organizations aligned with strategic goals—daily. This article outlines the five essential Power BI KPIs every CEO should monitor daily, explains how they drive executive decision-making, and demonstrates how Power BI consulting services, Power BI development, and business intelligence services can transform raw data into a competitive advantage. Why CEOs Need an Executive Dashboard Built in Power BI An executive dashboard is not a collection of charts—it is a strategic narrative. We design Power BI executive dashboards to answer one question: Are we winning today? CEOs operate at the intersection of vision and execution, and they need instant visibility into performance without digging through reports. Power BI stands out as the platform of choice because it integrates seamlessly with ERP systems, CRM platforms, cloud databases, and third-party applications. With real-time data refresh, AI-powered insights, and enterprise-grade security, Power BI delivers a single source of truth across the organization. From a leadership perspective, a well-designed dashboard offers: Our experience as a Power BI service provider shows that CEOs who rely on daily dashboards lead with confidence, precision, and agility. KPI #1: Revenue Performance and Growth Rate Revenue is the lifeblood of every organization, and it deserves top placement on the executive dashboard. We recommend tracking total revenue, month-over-month growth, year-over-year growth, and revenue by segment through interactive Power BI reports. A CEO should be able to answer, at a glance: Using Power BI data modeling and DAX calculations, we build revenue dashboards that highlight trends, anomalies, and forecasts. Visual elements such as KPI cards, trend lines, and waterfall charts allow executives to move from overview to insight in seconds. For service providers and consultants, this KPI also supports predictive analytics, enabling leadership to anticipate revenue gaps before they materialize. Revenue dashboards are not about hindsight—they are about foresight. KPI #2: Operating Profit Margin Revenue without profitability is noise. That is why operating profit margin is a non-negotiable KPI for CEOs. This metric reveals how efficiently the organization converts revenue into profit after operational costs. Through Power BI financial dashboards, we track: What makes Power BI uniquely powerful is its ability to blend financial and operational data. CEOs can drill down from a high-level margin view into specific cost centers, departments, or processes impacting profitability. We often implement row-level security (RLS) and custom Power BI visuals to ensure sensitive financial data is accessible only to authorized executives. The result is a secure, transparent, and actionable profitability dashboard that supports strategic cost control and margin optimization. KPI #3: Cash Flow and Liquidity Position Profitability does not guarantee liquidity. CEOs must monitor cash flow daily to ensure the organization can meet its obligations, fund growth, and withstand volatility. A Power BI cash flow dashboard provides real-time visibility into financial resilience. Key metrics include: By integrating Power BI with accounting systems and banking data, we deliver real-time cash flow analytics that replace static spreadsheets. CEOs can identify bottlenecks in collections, assess payment risks, and optimize working capital. For organizations offering Power BI implementation services, this KPI is often a turning point—transforming finance teams from reactive reporters into proactive advisors. KPI #4: Customer Health and Retention Rate Customers are not just revenue sources; they are long-term assets. CEOs need a clear view of customer retention, churn rate, and lifetime value to ensure sustainable growth. Power BI enables a holistic view of customer health by combining sales, support, and engagement data. A customer-focused executive dashboard tracks: With Power BI analytics, CEOs can see which customer segments are at risk and which drive long-term value. Interactive slicers allow leadership to analyze customer health by region, product, or account manager. From a strategic standpoint, this KPI supports data-driven decisions around pricing, product development, and customer experience investments—areas that directly influence competitive positioning. KPI #5: Workforce Productivity and Utilization People power performance. CEOs must understand how effectively their workforce converts effort into outcomes. A Power BI HR dashboard provides insights into productivity, utilization, and workforce trends without micromanagement. Critical workforce KPIs include: By integrating Power BI with HR systems, project management tools, and time-tracking platforms, we create dashboards that reveal productivity patterns across teams and departments. CEOs gain clarity on capacity constraints, skill gaps, and organizational efficiency. This KPI is especially valuable for professional services firms and IT consultancies, where utilization directly impacts profitability. With Power BI, workforce analytics become a strategic lever rather than an administrative burden. Designing the Ideal Power BI Executive Dashboard An executive dashboard must be intuitive, fast, and focused. We design Power BI dashboards for CEOs using best practices that prioritize clarity over complexity: We leverage Power BI service, Power BI Pro, and Power BI Premium to ensure scalability and performance. Advanced features such as AI insights, natural language queries, and automated alerts further enhance executive decision-making. As a Power BI consulting partner, we tailor each dashboard to leadership priorities, ensuring alignment with organizational strategy. Why Partner with a Power BI Service Provider Building an executive dashboard requires more than technical skills—it demands business acumen. As a Power BI development and consulting service provider, we bridge the gap between data and decisions. Our Power BI services include: Whether delivered as an individual consultant or a full-service BI partner, our goal is to empower CEOs with dashboards that drive clarity, confidence, and control. Conclusion: Leading with Insight, Not Instinct The modern CEO does not guess—they know. By monitoring the five essential Power BI KPIs—revenue growth, operating margin, cash flow, customer health, and workforce productivity—leaders gain a real-time pulse on organizational performance. An executive dashboard built in Power BI transforms data into a strategic

The Executive Dashboard: 5 Power BI KPIs Every CEO Should Watch Daily Read More »

Agile DevOps workflow enabling faster releases and real-time performance tracking.

Agile DevOps Excellence: A Framework for Streamlined Software Delivery and Performance Tracking

Introduction Agile DevOps is the modern approach that unifies Agile development and DevOps practices to deliver software faster, smarter, and with greater reliability. It transforms software delivery into a continuous, automated workflow where collaboration, rapid feedback, and shared ownership drive performance. By aligning development sprints with deployment cycles, Agile DevOps enables teams to release high-quality software consistently. This model empowers organizations to scale innovation while maintaining operational stability and measurable results. Building a High-Performance DevOps Model for Modern Teams DevOps Is a Culture, Not a Job Title DevOps general practices have evolved far beyond a technical function. In modern organizations, DevOps represents a shared mindset that unifies development, operations, quality assurance, and security into a single delivery ecosystem. We no longer treat DevOps as a standalone team or a set of tools; instead, it becomes the cultural backbone of how software is built, released, and improved. This cultural shift emphasizes collaboration, transparency, accountability, and continuous learning across all roles involved in software delivery. A high-performance DevOps model breaks down silos that traditionally slowed innovation. Developers understand production realities, operations teams participate early in design decisions, and quality becomes everyone’s responsibility. This alignment reduces friction and creates faster feedback loops. Agile DevOps strengthens this culture by introducing short iterations, rapid validation, and constant reprioritization based on real-world feedback. Together, Agile and DevOps create an environment where speed and stability coexist. Organizations that embrace DevOps culture see measurable improvements in delivery reliability, employee engagement, and customer satisfaction. Instead of reacting to failures, teams proactively design systems for resilience. This cultural maturity is what differentiates elite DevOps organizations from those merely adopting DevOps tools. The Intersection of Agile and DevOps Agile DevOps is the natural convergence of iterative development and continuous delivery. Agile focuses on how teams plan and build software, while DevOps extends those principles into deployment, monitoring, and operations. When combined, they form a DevOps framework that supports rapid experimentation without sacrificing control. Agile ceremonies such as sprint planning and retrospectives feed directly into DevOps workflows. Each sprint becomes an opportunity to release, measure, and learn. This tight integration ensures that development velocity translates into real customer value rather than accumulating unfinished work. Understanding the DevOps Workflow – From Code to Customer The Continuous DevOps Workflow Explained The DevOps workflow is a continuous loop that connects every stage of software delivery into a single, automated pipeline. Unlike traditional linear models, this workflow emphasizes constant feedback and incremental improvement. The core stages include plan, build, test, release, deploy, operate, and monitor. Planning aligns business objectives with technical execution. Backlogs are refined continuously, ensuring that teams focus on high-impact work. During the build phase, standardized build tools in DevOps environments compile code and generate deployable artifacts with consistency and speed. Testing is embedded directly into the pipeline using DevOps testing tools. Automated tests validate functionality, performance, and security early and often. This reduces risk and increases confidence in every release. Release, Deploy, and Monitor Deployment tools in DevOps enable frequent, low-risk releases through automation and version control. Continuous delivery pipelines ensure that code can move to production at any time. Once deployed, monitoring tools in DevOps collect metrics, logs, and traces to provide real-time visibility into system health and user experience. This closed-loop DevOps workflow ensures that insights from production feed directly back into planning, creating a self-improving delivery system. Agile DevOps – Syncing Development Sprints with Deployment Cycles Aligning Sprints with Continuous Delivery Agile DevOps eliminates the gap between development completion and production deployment. Each sprint is structured so that completed work is potentially releasable. This requires small batch sizes, strong automation, and disciplined backlog management. DevOps automation tools play a critical role in synchronizing sprints with deployment cycles. Automated builds, tests, and deployments reduce manual effort and human error. As a result, teams can deploy multiple times per day without increasing operational risk. Shared Ownership and Accountability When sprints and deployments are aligned, teams take full ownership of their work throughout the lifecycle. DevOps engineer tools such as CI/CD platforms, infrastructure-as-code solutions, and artifact repositories support this ownership by making environments reproducible and transparent. The Modern DevOps Toolchain and Technologies DevOps Tools List Across the Lifecycle A robust DevOps toolchain integrates multiple categories of tools, each serving a specific purpose. Typical components include source control systems, build tools in DevOps, DevOps testing tools, configuration management tools in DevOps, deployment tools, and monitoring platforms. The best DevOps tools are those that integrate seamlessly and support automation at scale. Tool selection should prioritize reliability, extensibility, and ease of integration rather than individual features. Configuration Management and Automation DevOps configuration management ensures consistency across environments by treating infrastructure and configuration as code. This approach reduces configuration drift and simplifies scaling. Power platform build tools and cloud-native automation further enhance efficiency by abstracting infrastructure complexity. DevOps Testing, Security, and Reliability DevOps Testing Tools and Continuous Quality DevOps testing transforms quality assurance into a continuous activity. Automated tests run at every stage of the pipeline, validating code changes immediately. This proactive approach reduces defect rates and accelerates delivery. DevOps Security Tools and Shift-Left Security DevOps security tools integrate security checks directly into development and deployment pipelines. Vulnerability scanning, dependency analysis, and compliance checks run automatically, ensuring security without slowing delivery. This shift-left approach embeds security into daily workflows. Monitoring Tools in DevOps and Observability From Monitoring to Observability Monitoring tools in DevOps provide visibility into system performance, availability, and reliability. Modern observability platforms go further by correlating logs, metrics, and traces to uncover root causes quickly. This performance intelligence enables teams to respond proactively, reduce downtime, and continuously optimize user experience. Key DevOps KPIs for Performance Tracking Core DevOps KPIs Explained DevOps KPI tracking provides objective insights into delivery performance. Deployment Frequency measures how often value reaches customers. Lead Time for Changes reflects how quickly ideas are delivered. Mean Time to Recovery evaluates resilience, while Change Failure Rate balances speed with stability. Tracking these KPIs aligns teams around outcomes and supports data-driven decision-making. Choosing the

Agile DevOps Excellence: A Framework for Streamlined Software Delivery and Performance Tracking Read More »

IoT solutions improving visibility and automation in retail and manufacturing.

The Ultimate Guide to IoT Across Retail and Manufacturing in 2026

The Internet of Things is no longer a futuristic concept—it’s the quiet engine driving some of the biggest transformations in retail and manufacturing today. In 2026, IoT for retail and IoT for manufacturing are not optional upgrades. They’re core business strategies. Whether it’s smart retail IoT reshaping how customers shop or smart manufacturing IoT redefining how products are made, connected devices are everywhere. Think about it: stores that know what customers want before they ask, factories that fix machines before they break, and cloud platforms that let you manage thousands of devices from a single dashboard. That’s not science fiction—that’s IoT in action. This guide takes a deep, practical look at how IoT applications in retail, manufacturing, and cloud services work together. We’ll explore real-world retail IoT applications, internet of things manufacturing systems, remote IoT platforms, and the cloud infrastructure that ties everything together. No jargon overload—just clear, useful insight you can actually apply. Understanding IoT: The Digital Backbone of Modern Industries At its simplest, IoT connects physical devices to digital systems. Sensors, machines, cameras, shelves, robots—all of them collect data and communicate through an IoT cloud. But in 2026, IoT is less about devices and more about decisions. What makes IoT powerful today is context. Data isn’t just collected—it’s analyzed, correlated, and acted upon in real time. A temperature sensor in a supermarket freezer can trigger alerts, adjust cooling systems, and notify maintenance teams automatically. A vibration sensor in a factory can predict equipment failure weeks in advance. For industries like retail and manufacturing, IoT becomes the nervous system of operations. It senses what’s happening on the ground and sends that information to the brain—the cloud—where smarter decisions are made. This shift from reactive to proactive operations is why IoT in retail industry and IoT in manufacturing industry continue to grow at record speed. IoT for Retail: Transforming the Customer Experience IoT for retail has completely changed how stores operate and how customers interact with brands. Smart retail IoT solutions turn physical stores into data-rich environments where every interaction tells a story. Imagine walking into a store where digital shelves update prices automatically, smart cameras analyze foot traffic, and personalized offers appear on your phone in real time. That’s smart retail using IoT. Retailers gain visibility into customer behavior, while shoppers enjoy convenience and personalization. IoT for retailing industry success comes from connecting everything—point-of-sale systems, inventory, lighting, HVAC, and security—into one intelligent ecosystem. Retail IoT applications don’t just boost sales; they reduce waste, cut operational costs, and improve employee productivity. In 2026, the best retail experiences are built as much with sensors and software as with shelves and products. IoT in Supermarkets: From Shelves to Supply Chains IoT in supermarkets is one of the clearest examples of practical IoT value. Supermarkets deal with thousands of products, tight margins, and constant customer demand. IoT applications in retail solve these challenges head-on. Smart shelves track inventory levels in real time. When stock runs low, the system automatically triggers restocking workflows. Cold-chain sensors monitor temperature for perishable goods, reducing spoilage and ensuring compliance. Cameras and weight sensors help prevent theft and reduce checkout friction. Beyond the store, IoT connects supermarkets to suppliers and distribution centers. This end-to-end visibility allows better forecasting, fewer out-of-stock situations, and smoother logistics. The result? Lower costs, fresher products, and happier customers—all driven by retail IoT applications working quietly in the background. Retail IoT Applications That Are Redefining Operations Retail IoT applications go far beyond inventory tracking. They touch every part of the business, from marketing to maintenance. One powerful application of IoT in retail is personalized engagement. Beacons and mobile apps detect customer preferences and deliver targeted offers. Another is energy optimization—smart lighting and climate systems reduce costs without sacrificing comfort. Loss prevention is also evolving. AI-powered cameras and sensors detect suspicious behavior without invasive monitoring. Combined with IoT cloud analytics, retailers gain actionable insights rather than raw footage. These iot retail applications don’t just improve efficiency—they fundamentally change how stores operate, making them smarter, leaner, and more responsive. Retail IoT Solutions: Building Smarter, Faster Stores Retail IoT solutions work best when built on a strong foundation. That foundation includes connected devices, a reliable IoT cloud, and scalable analytics. A typical retail IoT solution includes sensors, gateways, connectivity, cloud storage, and dashboards. The real magic happens when these components work together seamlessly. Cloud-based platforms allow retailers to deploy updates, monitor performance, and analyze trends across hundreds of locations. Choosing the right IoT cloud is critical. It determines scalability, security, and integration with existing systems. In 2026, successful retail brands treat IoT not as a one-time project, but as a long-term platform for innovation. IoT Services Powering Modern Businesses Behind every successful IoT deployment are specialized IoT services. These include IoT installation services, platform configuration, and ongoing support. A remote IoT platform allows businesses to monitor and control devices from anywhere. Whether it’s a smart shelf in a supermarket or a sensor in a factory, everything connects through the same cloud interface. This centralization reduces complexity and accelerates decision-making. IoT installation services ensure devices are deployed correctly, securely, and efficiently. With the right services in place, businesses can focus on outcomes instead of infrastructure. IoT services turn complex technology into usable business tools. Remote Management IoT: Controlling Devices at Scale Remote management IoT is the backbone of large-scale deployments. Managing thousands of devices manually simply isn’t realistic. IoT remote management software enables real-time monitoring, remote configuration, and over-the-air updates. If a device fails, the system detects it instantly. If firmware needs updating, it happens automatically—no site visits required. Remote IoT device management also improves security. Devices can be isolated, patched, or decommissioned instantly. In 2026, remote management IoT isn’t just about convenience—it’s about resilience and control in a connected world. IoT Device Management Companies and Ecosystems IoT device management companies play a crucial role in simplifying complexity. They provide platforms, tools, and expertise that help businesses scale faster and safer. The best providers offer device onboarding, monitoring,

The Ultimate Guide to IoT Across Retail and Manufacturing in 2026 Read More »